

Working on the Railroad
Working on the Railroad
Buffett, History, Competition, Future Returns

Buffett Buys A Railroad:
In the depths of the 2008 financial crisis, Warren Buffett wrote a memorable opinion piece in the NY Times titled “Buy American. I Am.” It sprinkled history, wisdom, and reason to illustrate that betting on US stocks for the long term remains the best choice a person can make. A little over a year later in November 2009, he followed through on that thought with the biggest investment of his career thus far - $34B for the BNSF railroad. A true wager on the strength of the American economy and a critical component of the transportation backbone. In the recent 2020 annual letter for Berkshire Hathaway, Buffett described BNSF as the second most valuable asset in Berkshire (well, basically tied with a 5.4% stake in Apple), and only behind their insurance operation. He also divulged that BNSF has already paid $42B in dividends to Berkshire and made $41B in capital expenditures since that 2010 purchase.

Source: BNSF 10-K Reports
So how has that purchase from 11 years ago done? Well, the dividends returned to Berkshire go into the compounding machine that Buffett has built. Book value growth can be used as a proxy for estimating the compounding rate, and Berkshire equity has gone from $131B at year end 2009 to $443B at year end 2020. Good for a 11.7% CAGR. Assuming that compounding rate (a rough assumption, I know), those $42B in dividends from BNSF are worth $72B today. Estimating a current value for BNSF can also be done in a simple manner using another railroad. The main BNSF competitor, Union Pacific (UNP), is remarkably similar in size, geographic scope, and revenue. From 2010-2020, I calculate that BNSF net income averaged about 87% of UNP, although recently it has been a bit closer (92% over the 2018-2020). Using 90% as a simple estimator, and the UNP market capitalization of $140B at year end 2020, BNSF is worth approximately $126B. This matches closely with the Buffett statement about BNSF equaling the Apple stake, which was worth $120B at year end. Adding it up, the $34B to buy BNSF turned into ~$198B in value today. That is a 17.3% annualized return over 11 years, extremely impressive for that amount of capital. Better than both Berkshire stock and the S&P 500 index over that time frame.
You Could Have Beat Buffett:
It turns out you could have simply bought that remarkably similar competitor and done even better than Buffett. From 2010 – 2020 (and that means buying two months after Buffett announced the BNSF purchase), UNP stock total return was 722%, or good for a 21% CAGR. I have recently become quite interested in this chart (exhibit 1) from a BCG study that decomposes stock returns into different components. It basically boils down to the fact that valuations and sentiment can drive a lot of the return in shorter time frames, but that business performance (sales and profits) drives most of the returns over longer time frames. The study is only through 2013 and I have yet to find a comprehensive update. I decided to pull up the relevant information for UNP from Koyfin in the chart below:
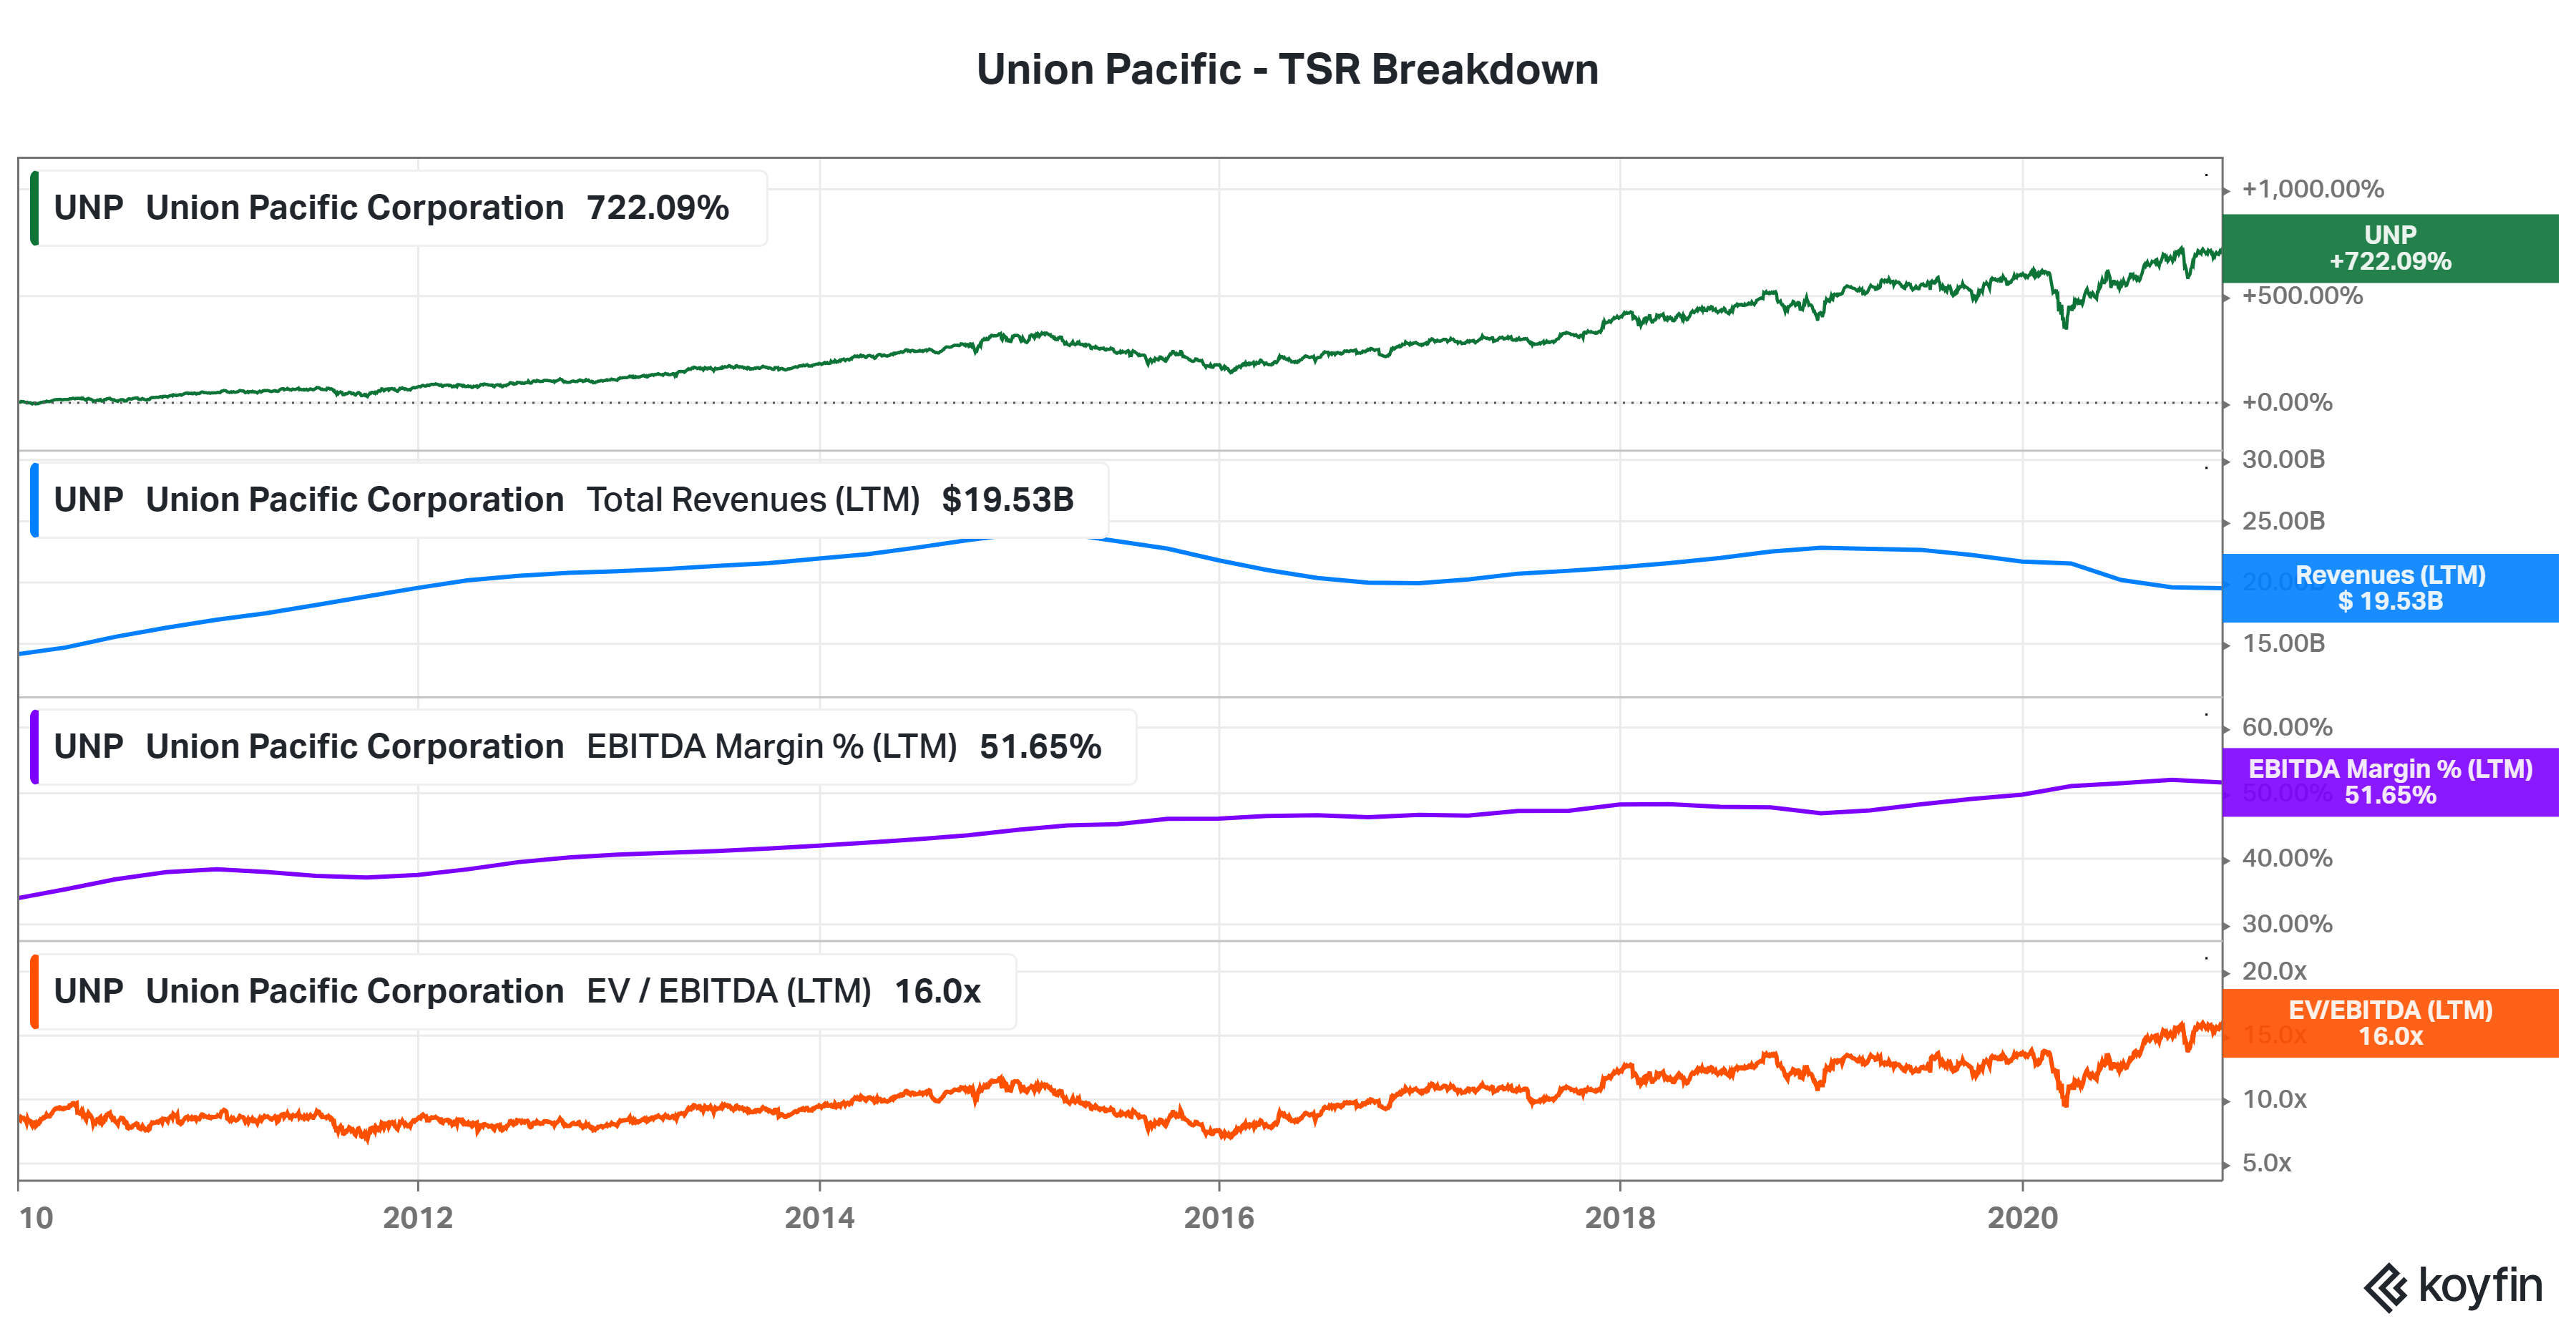
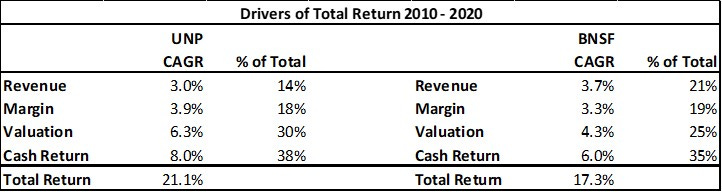
I used trailing EBITDA margins and valuations as that is what BCG typically uses for non-financial companies. One might argue that using 2009 as a start or 2020 as an end could be misleading due to freight recessions, but since it happened at both ends it is likely comparable to looking at say 2008 – 2019 or 2007 – 2018. See the calculated information in the table below. Surprisingly, the split in driver of returns for UNP was almost equal between business performance (revenue and margins), valuation, and cash returns. A good way to think about the cash return component is that it is a mix of dividends and share repurchases aided by increased debt. To further illustrate this – although UNP had a total return CAGR of 21.1%, the CAGR for stock price was 18.3%, for the market cap was 14.3%, and for the enterprise value was 13.7%. I then did the comparable breakdown for BNSF, and although the valuation is based off UNP, we can see a similar split in the driver of returns. BNSF had slightly higher revenue growth with slightly lower margin improvements.
So the real question to consider – is this sustainable? Can a railroad continue to compound at high rates of return for the next decade and beyond? Considering the US GDP grew at about a 3%+ rate over the last decade, and these railroads approximately matched that on the top line, that seems unlikely to dramatically shift for the next decade. But that may be worth investigating. Expanding valuations are not sustainable over the long term, although the rise in EV/EBITDA is somewhat justified by the improved margin structures and the new normal of lower interest rates. Cash returns will likely continue as they have previously. Margins have been improving across the industry in recent years thanks to the adoption of precision scheduled railroading (PSR), but there must be some natural ceiling there. Consider this chart (figure 25) from Yardeni. The only industries that have historically seen sustained multiyear margins above 20% are biotechnology, tobacco, and software.
Some Brief Railroad History:
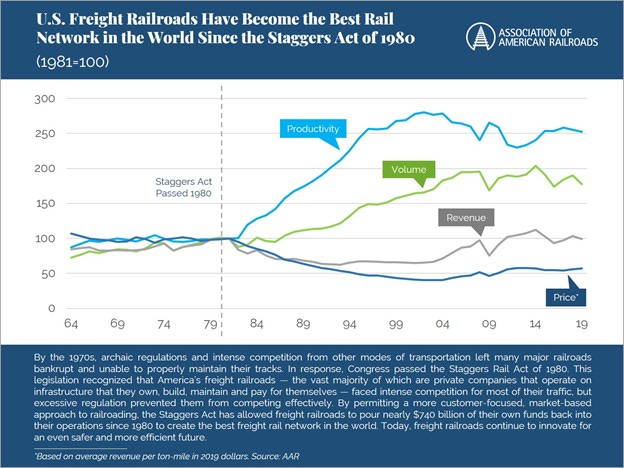
As pioneers in developing the modern American economy, people might think railroads have been great businesses forever. By the 1970’s, however, stringent regulations and rising truck competition left the industry struggling. The Penn Central bankruptcy in 1970 was the largest in American history until it was surpassed by Enron in 2001. The Staggers Act was passed in 1980 deregulating the railroad industry and spurred an era of capital investment, productivity improvements, rationalization, and strong growth. It has been a massive success for railroads, shippers, and the public interest. See the AAR infographic below:
The industry experienced significant consolidation in the 20 years post Staggers and after numerous mergers only seven Class I railroads remain. They operate nicely as regional duopolies with UNP and BNSF covering the Western US.
The operating ratio is a key metric the industry focuses on. It is simply your operating expenses as a percentage of revenue, or 1 – EBIT margin %. Railroads have unique characteristics that may cause differences, such as geographic terrain, customer commodity mix, or public versus privatized health care costs when comparing Canadian and US railroads. But generally, the operating ratio is a good measure of how efficiently the railroad is running.
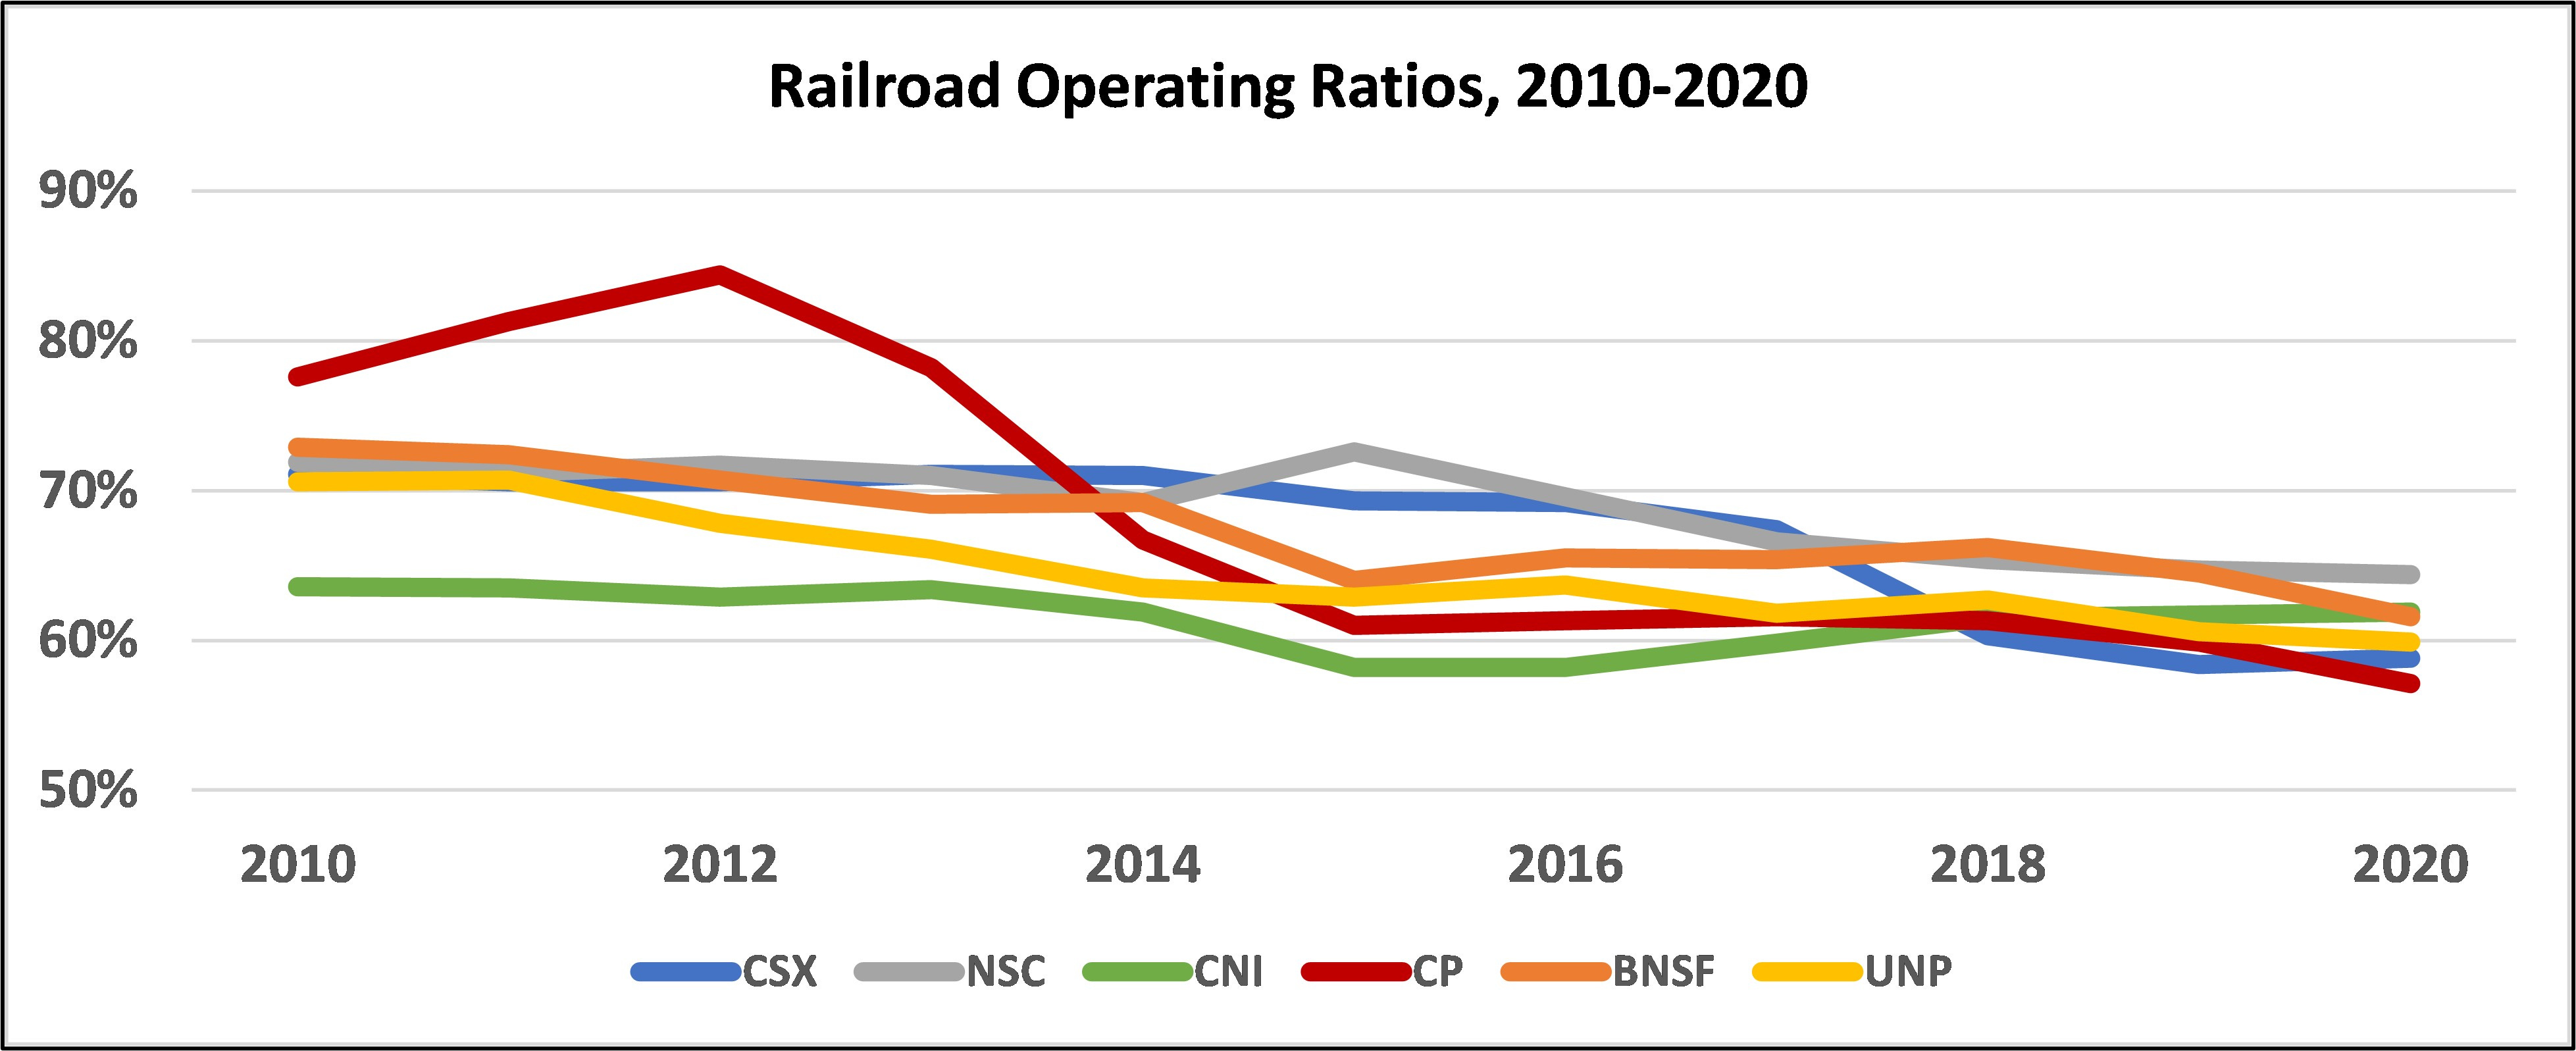
Hunter Harrison is quite famous for developing the precision scheduled railroading (PSR) operating principles at Illinois Central in the 1990’s before it was acquired by Canadian National (CNI). Over the 2000’s he guided CNI to be the be the most efficient railroad in the industry. In 2012 he was pulled out of retirement by Bill Ackman and Pershing Square to join Canadian Pacific (CP) as CEO and overhaul their operations. After a successful four plus years, he abruptly resigned from CP and joined CSX in 2017 as CEO. Although only lasting one year (before passing away) at CSX, the changes implemented there had quick repercussions. The industry by this time had really taken note and in 2018, many other railroads (UNP, NSC, KSU) began implementing PSR practices. Look at the operating ratios below and note the impact of PSR:
Source: Company Financial Reports
PSR principles are driven by an operating focus to create improved service and productivity. It starts with balancing the train schedule and following that closely to optimize the network. Keeping the terminals fluid helps ensure reliability and prevents cascading backups throughout the network. This combination leads to service improvements – both faster times and more reliability. This setup yields increased asset and employee productivity and can be evident in larger train sizes, higher fuel efficiency, faster asset turns, and more output per employee. Wall Street has loved the financial results, lowered operating ratios, and improved service. The philosophy should increase network capacity over time, leading to volume growth opportunities.
Competition:
Revenue is a function of both price – the rate a railroad charges for a shipment, and volume – the quantity of shipments made. Although UNP and BNSF have averaged 3-4% annual revenue growth for a decade, carloads are only up 0% and 13% respectively. Looking at ton-miles, an alternative measure of volume, UNP and BNSF are down 20% and 1% from 2009. A lot of the volume decline can be attributed to the secular fall of coal, but the real story is that the railroads have pricing power. Even in a stagnant volume environment, rates can match or exceed inflation, and provide revenue growth.
The big question that remains, however, is if railroads can successfully compete with trucks. Traditionally the lower marginal costs, better fuel efficiency, and environmental benefits of rail are weighed against the faster speed, higher costs, and the full geographic coverage of the trucking industry. Rail intermodal typically requires drayage to deliver shipments to final destinations and the heavy fixed costs of the rail network mean they are more advantageous over longer haul lengths. Typically, anything under 500 miles will be challenging for rail to compete for, while over 1000 miles rail should have a notable cost advantage. Here is a quick look at intermodal volumes to see how UNP and BNSF have done over the past decade.
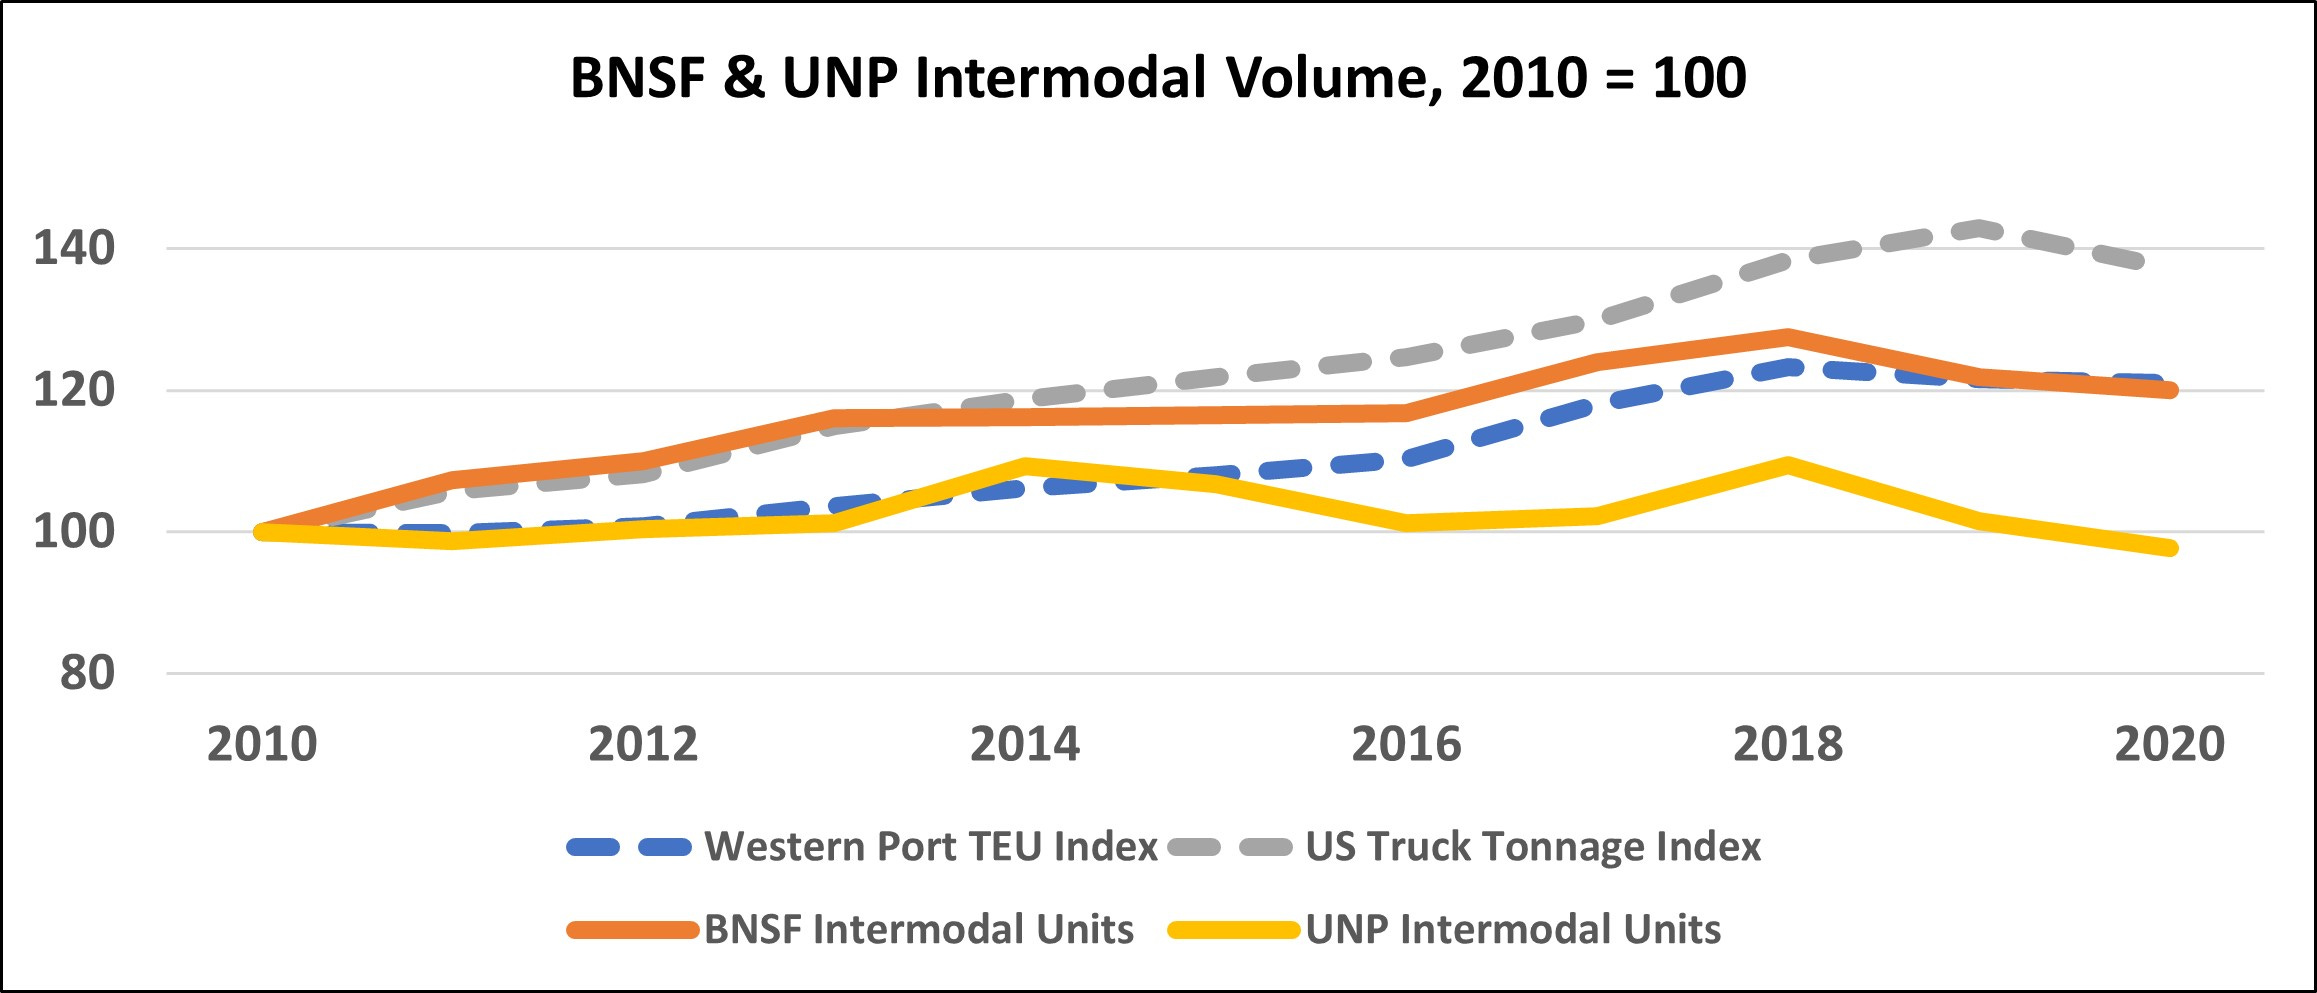
Source: AAR Weekly Carload Reports, BTS, Port Websites
Surprisingly, they have not gained any market share over the past decade. It begs the question, why? Market developments, such as the Panama Canal expansion, or the growth in volumes at Prince Rupert, have shifted some Asian volumes away from the Western hub of LA/Long Beach, but the railroads have barely kept pace with the TEU counts in the West. International was 50% of UNP intermodal volume earlier in the decade but has dipped to ~40% in more recent disclosures. Intermodal is a lower margin business than legacy merchandise traffic, and railroads do not appear to be sacrificing pricing power for gaining market share. UNP more so than BNSF appears to hold firmer on margins in relation to volumes.
Shifting to non-intermodal business, the story has been the decline of coal versus everything else. As a percentage of non-intermodal carloads, coal has dropped from 40-50% a decade ago to 17% for UNP and 32% for BNSF in 2020. For the non-coal commodity groups, UNP and BNSF seem to be slowly growing revenue, plodding along with the ebbs and flows of the economy. I was curious as to the rail-rail competition (see table below) and the relative market shares have not changed much. This is a sign of rational competition with two mature companies acting in a reasonable manner. There are areas where UNP is advantaged (chemicals, automotive), and areas where BNSF is advantaged (grain, coal), but generally the market shares are quite stable.

Source: STB QCS Reports, AAR Commodity Definitions
Future Returns:
Inspired by a John Huber post about returns on incremental capital, I did some high-level summary math for UNP and BNSF. The thesis is that the compounding rate of a company over the long term should approximate the reinvestment rate multiplied by the returns on incremental capital. The math to calculate incremental capital gets a bit messy, but it is mostly comprised of capital expenditures less depreciation. The reinvestment rate is simply the incremental capital divided by net income over the period. I adjusted 2017 numbers down as the change in corporate tax rate reduced the deferred tax liability and found that BNSF had a 45% reinvestment rate and UNP 38%. These have been trending down the last few years as volumes have declined and might be closer to 20% recently. The incremental returns on capital use NOPAT (net operating profit after taxes) to simulate the returns for an unleveraged entity and I calculate both UNP and BNSF to be around 17%. This means an estimated compound rate for BNSF to be 7.6% and UNP to be 6.6%.
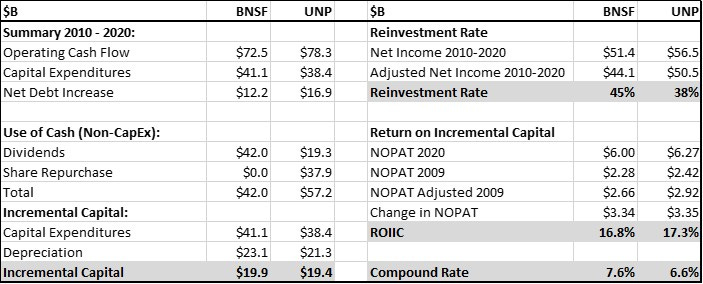
Source: Company Financial Reports
If we add in the cash return component of a few percent each year, it seems reasonable to expect that BNSF or UNP could provide a total return of say ~10% annually going forward. Not bad, but certainly not the 17-21% they provided over the last decade. They clearly have pricing power and great margin structures, but the dearth of growth makes me skeptical they will have significant reinvestment opportunities going forward. It is not unrealistic to envision a future where autonomous EV trucks, grouped in fleets, are driving along the highways. That might be ten plus years away, but unlike ten years ago, that possibility now seems attainable.
Just this past month, the two Canadian railroads – CP and CNI – have entered a bidding war to acquire Kansas City Southern (KSU). The price is getting high though, as KSU now trades above a 10X forward EV/Sales and 30X forward PE multiple. Both CP and CNI management are touting revenue growth as the major merger synergy with new single line access connecting Canada, US, and Mexico. It certainly should be an interesting story to follow.
Disclosure: Not investment advice. I own BRK.B shares.