
Carvana Other GPU
Digging In

The Carvana story has been on the periphery of my investing interests the past few years, but I never really dove in to study the business. The company IPO’d at $15 in 2017, catapulted all the way to over $300 last year, and recently fell 90%+ back to below $30 per share. Earlier this year, Carvana was named to the Fortune 500, becoming one of the four fastest companies to make the list via organic growth, along with tech titans Amazon, Google, and Facebook. In May, Carvana doubled down on growth as they closed an acquisition of Adesa’s US physical auction business for $2.2B. This allows them to lock in property for tripling their inspection and reconditioning center (IRC) capacity across the nation in coming years.
There are several notable investors whom I respect that have significant positions in the company (at least as of Q1 2022) – Cliff Sosin, Bryan Lawrence, and Rob Vinall. On the other hand, bearish takes on the stock claim the company is a Ponzi scheme and a subprime lender disguised as an ecommerce disruptor. The recent operational stumbles and Adesa acquisition forced them to raise more capital and it was not cheap - $1.25B of new stock issuance and $3.275B issuance of 10.25% 2030 debt. The dispersion of outcomes seems very wide here and makes it an extremely interesting case study. Will Carvana eventually dominate the fragmented used car market, or have they overleveraged themselves and will struggle to be sustainably profitable?
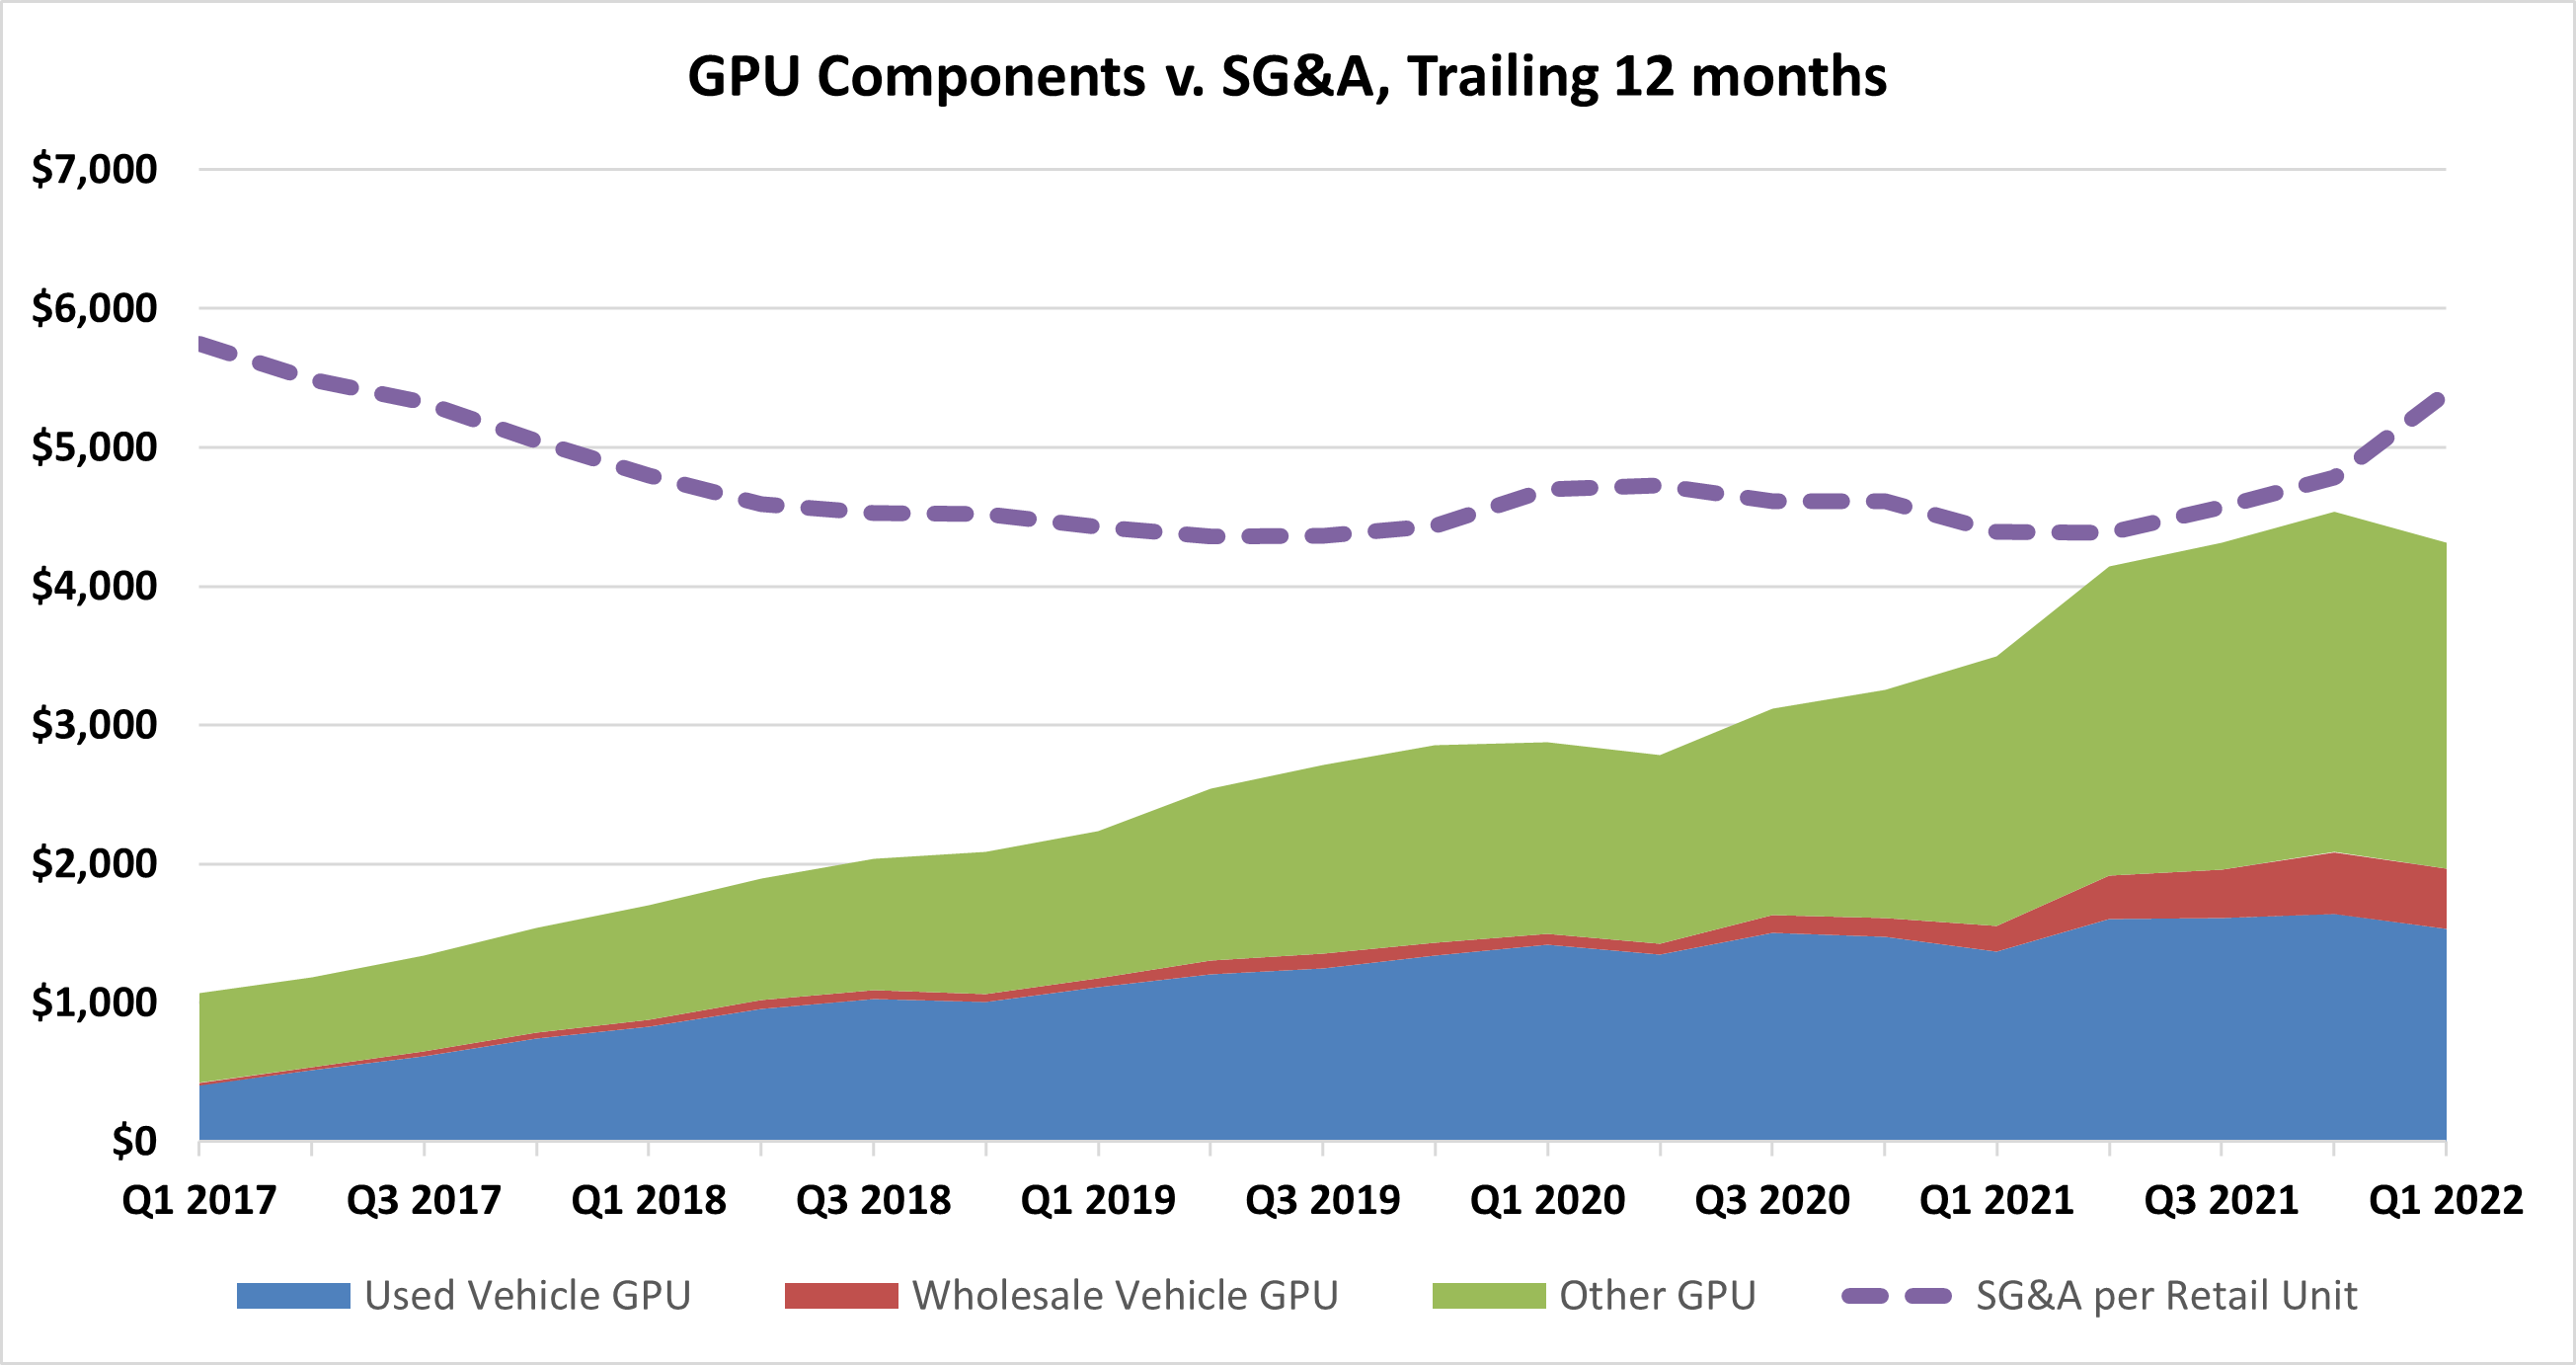
Carvana reports gross profit per retail unit (GPU) in three major components as seen in the chart below. Used vehicle gross profit is directly associated with selling the vehicle and is sometimes referred to as “metal” GPU. The drivers of this are well understood and include average days to sale, sourcing cars from customers versus wholesale market, as well as efficiency in use of both the IRC and logistics network. Wholesale vehicle GPU is just a function of the number of cars sold to wholesale relative to retail and the margins earned on those transactions. Other GPU, which includes financing and ancillary products, typically represents 50%+ of the total GPU for Carvana.
Carvana originates auto loans for customers but does not hold them on the balance sheet as they sell them to investors via different types of arrangements (more on that later). From 2018 to 2020, Carvana reported the “finance GPU” in quarterly earnings letters. This includes the profit from selling the loans in addition to interest earned on the loans prior to sale. The most prominent ancillary product Carvana sells is commissions from vehicle service contracts (VSC). Carvana originates the contracts, but DriveTime administers them, so Carvana receives a commission and since DriveTime is a related party the aggregate commissions are reported on a quarterly basis. The final piece of other GPU can be inferred and is other ancillary products, which is predominantly GAP waiver coverage.
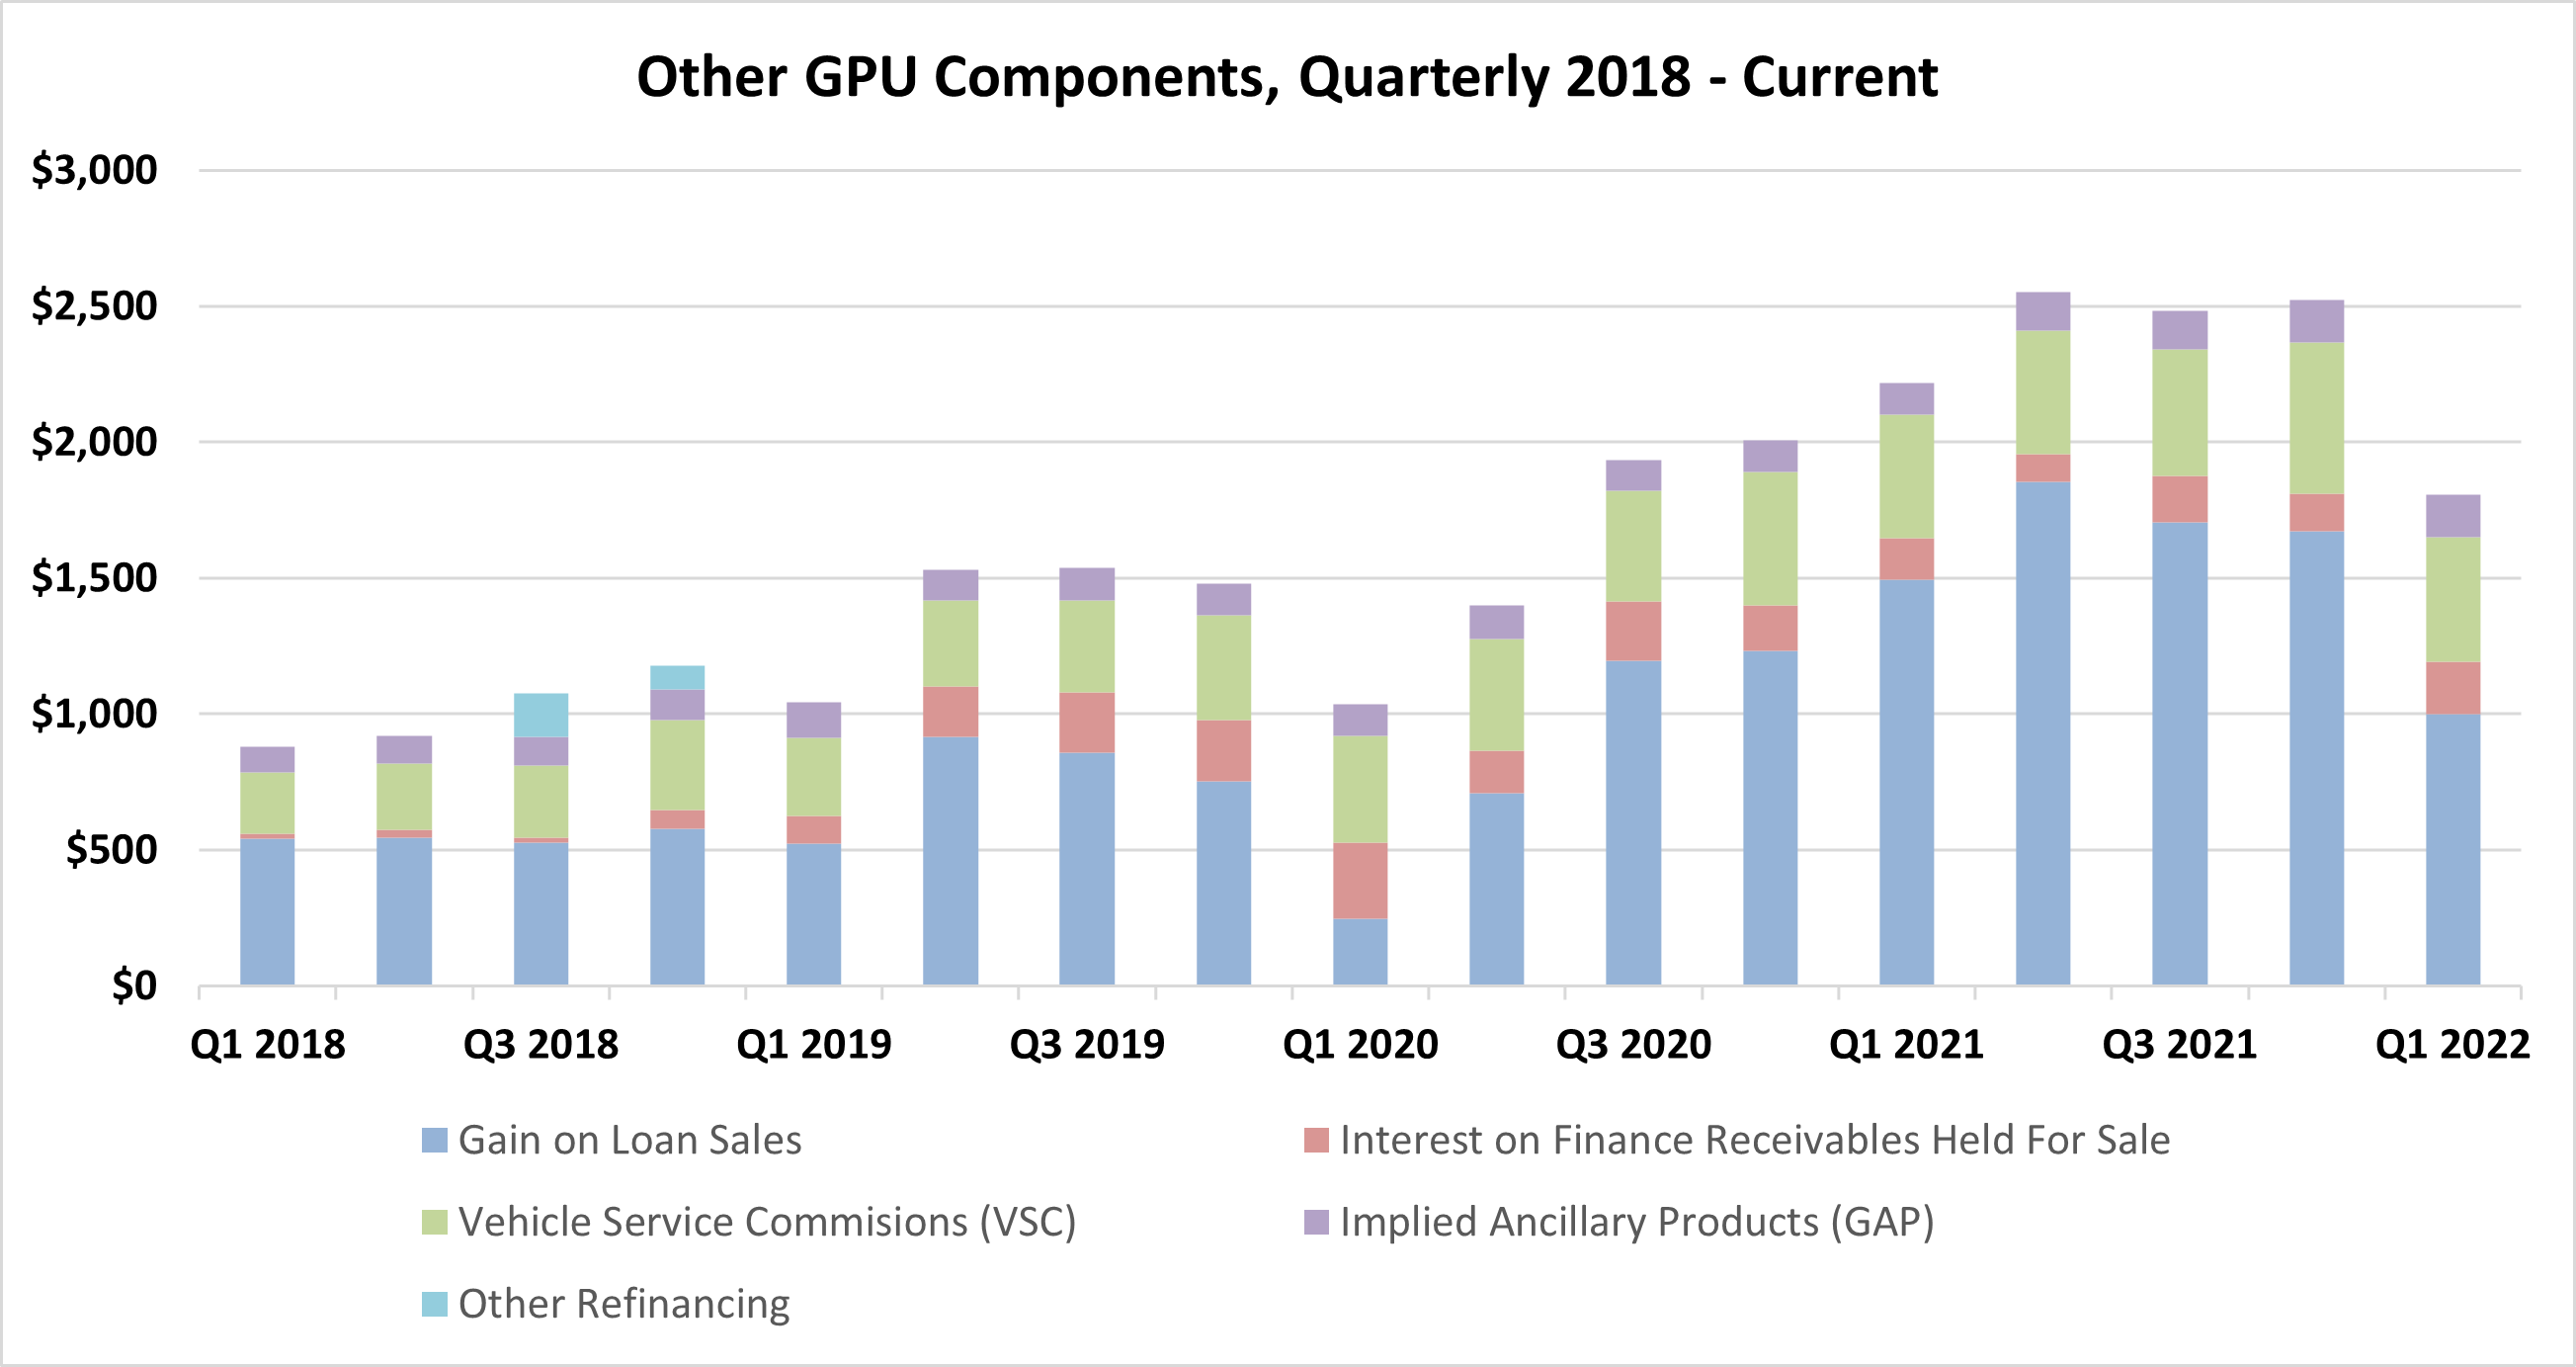
Note: Interest on finance receivables and implied ancillary products are estimated for 2021-2022.
A key question going forward is asking what level of other GPU is sustainable. VSC and other ancillary products have risen in dollar terms but have generally been steady as a percentage of retail sales revenue at ~2% and ~0.6%. The main driver of the fluctuations in other GPU is the gain on loan sales component. While this was $520-$580 in 2018 it hit a recent apex of $1855 in Q2 2021. It clearly jumps around significantly. To attempt to understand how this happened I had to investigate the types of arrangements Carvana uses to sell the loans it originates.
As the chart below shows, Carvana net sales of finance receivables have risen from $527M in 2017 to $7.4B in 2021. This is driven by a 9.6X increase in units sold, a 29% average increase in used car prices, and an increase in the financing penetration rate from 66% to 75%. For comparison, Carmax finance penetration has been steady in the 75%-80% range so it seems unlikely Carvana will go much higher as some customers pay in cash or use alternative financing. Carvana sells loans through two major types of arrangements – forward flow agreements where a banking partner agrees to buy all loans meeting certain underwriting criteria, and fixed pool loan sells where Carvana packages together thousands of loans to then be sold in the fixed income markets. The primary method for the fixed pool sales are securitization transactions in the ABS markets.
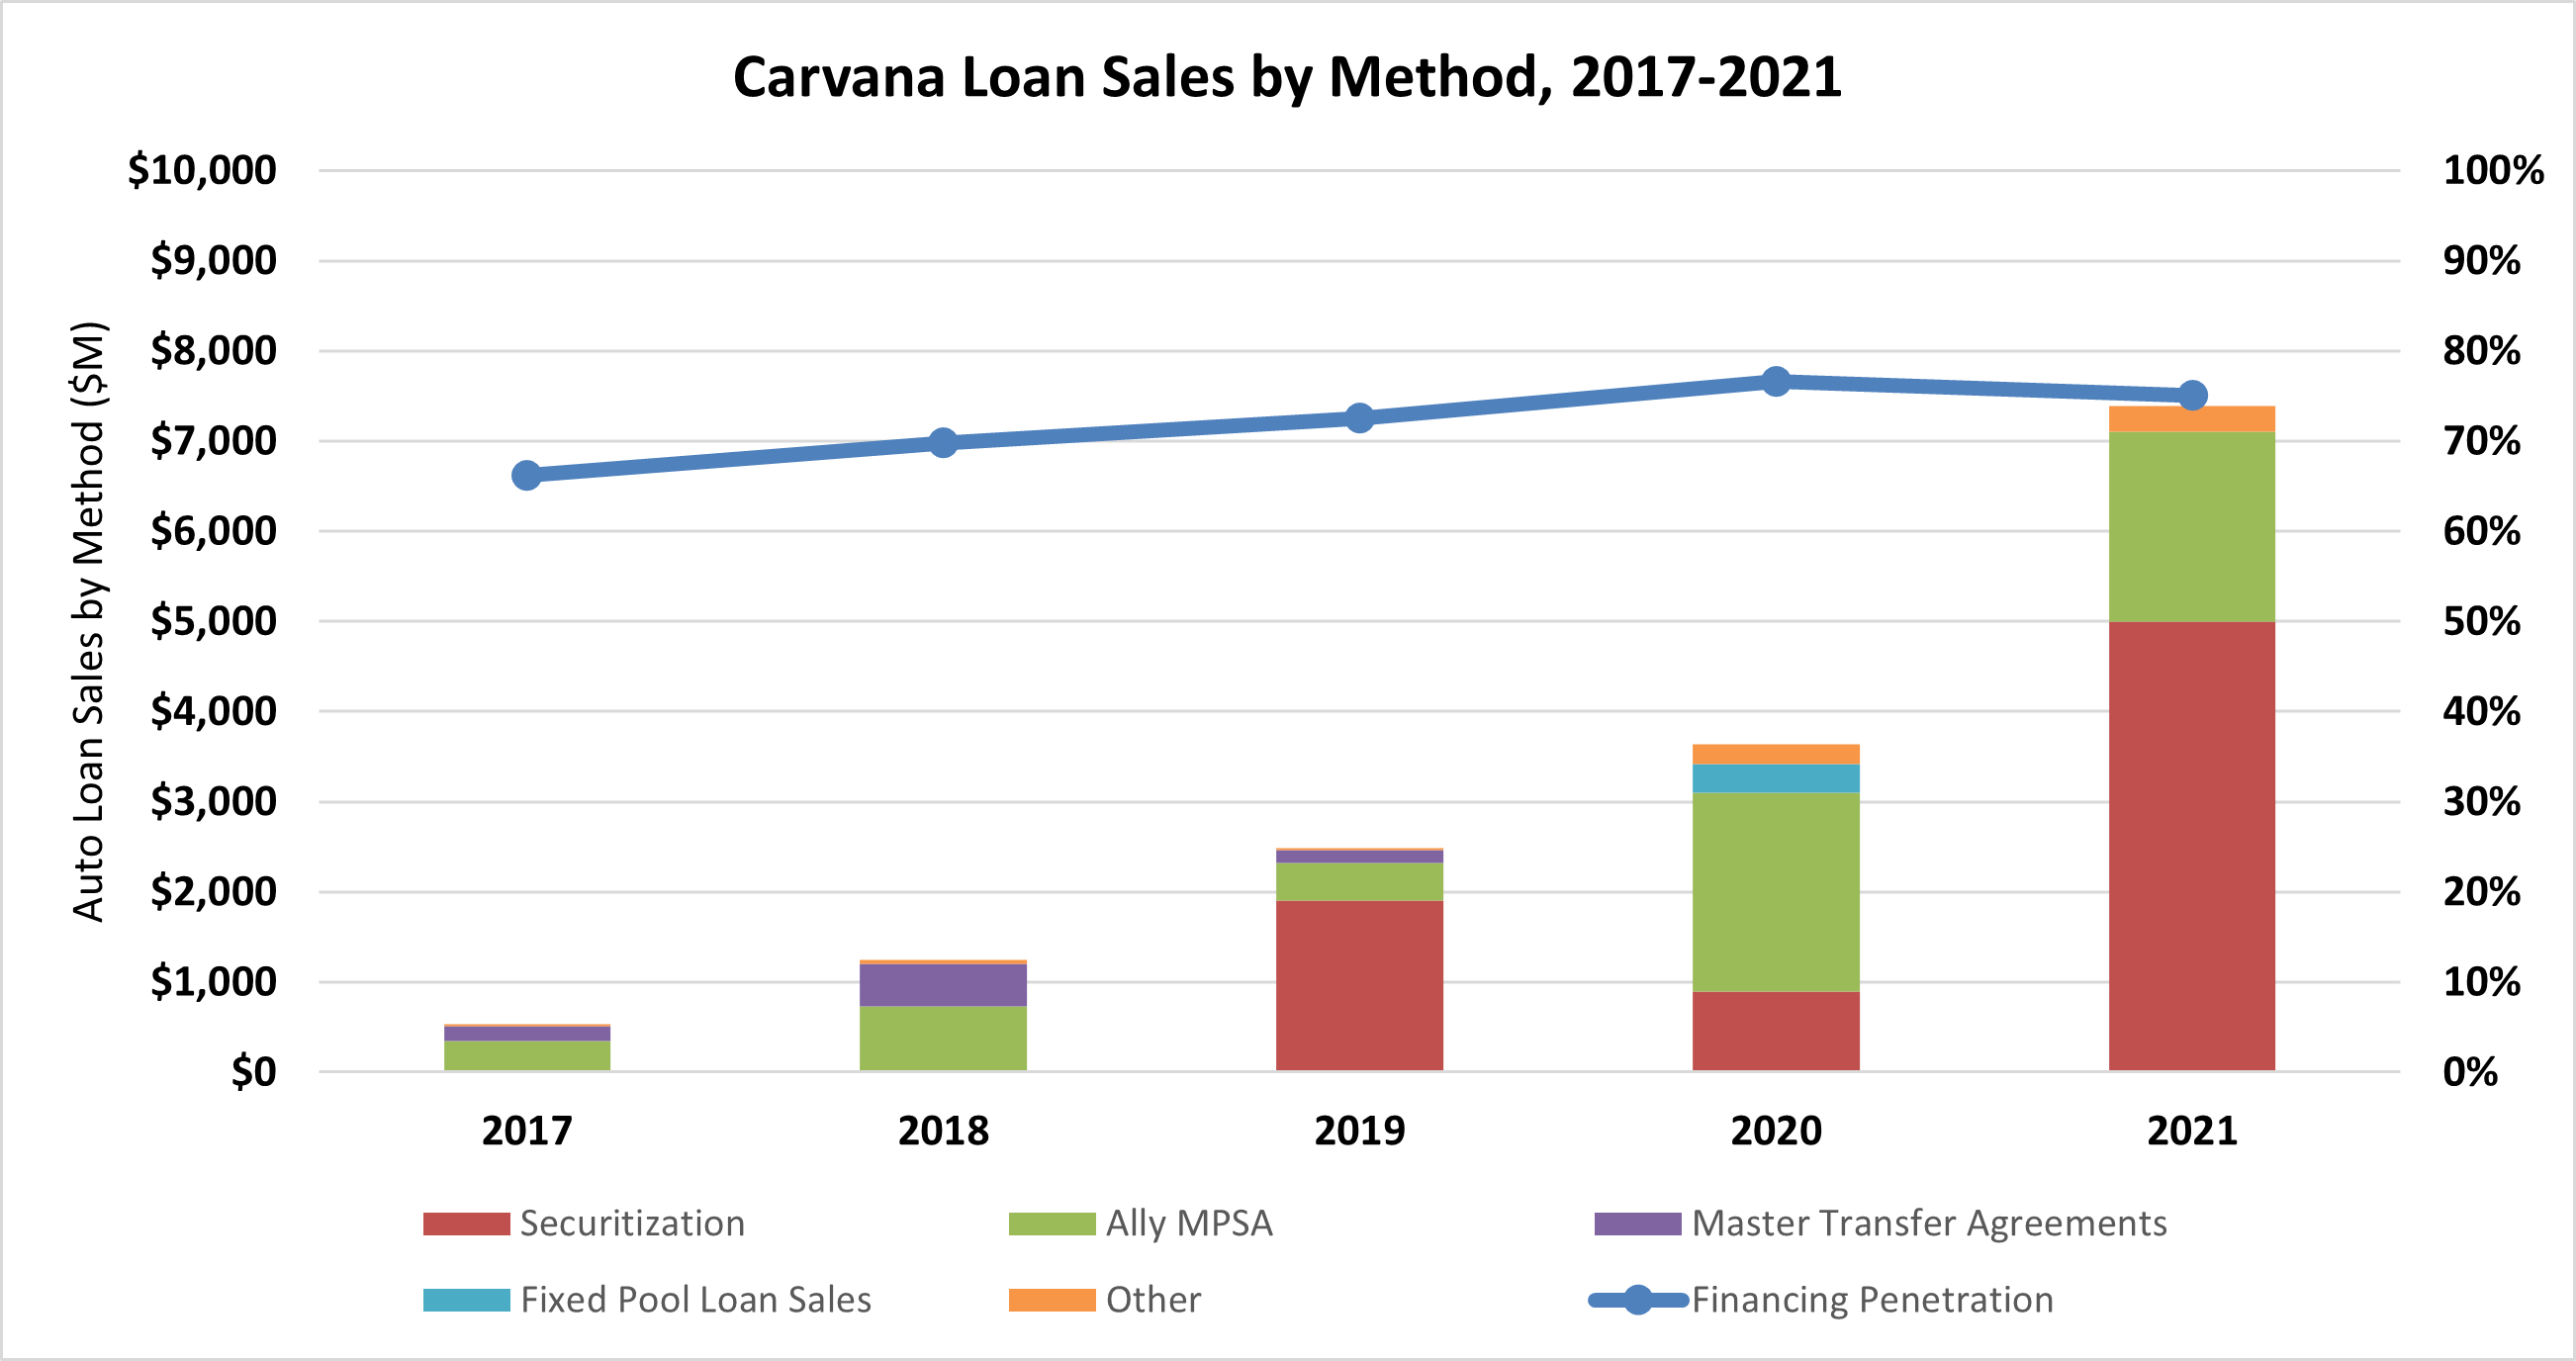
The shifts in channels where Carvana sells the auto loans originated is driven by higher aspirations for boosting finance GPU. Forward flow was the natural starting place with no history of loan performance and Ally has been a tremendous partner. Shifting to securitizations required more of a track record, and more use of the balance sheet, as Carvana is required to hold 5% of the beneficial interests for any securitization. The move to increase finance GPU via using securitizations can be described as lowering the cost of funds. Packaging loans reduces aggregate risk while segregating loans and ABS tranches allows fixed income investors to select their desired risk levels. The ABS markets offer a much larger range of potential buyers for the pooled loans and more buyers equals more competitive pricing and therefore lower cost of funds.
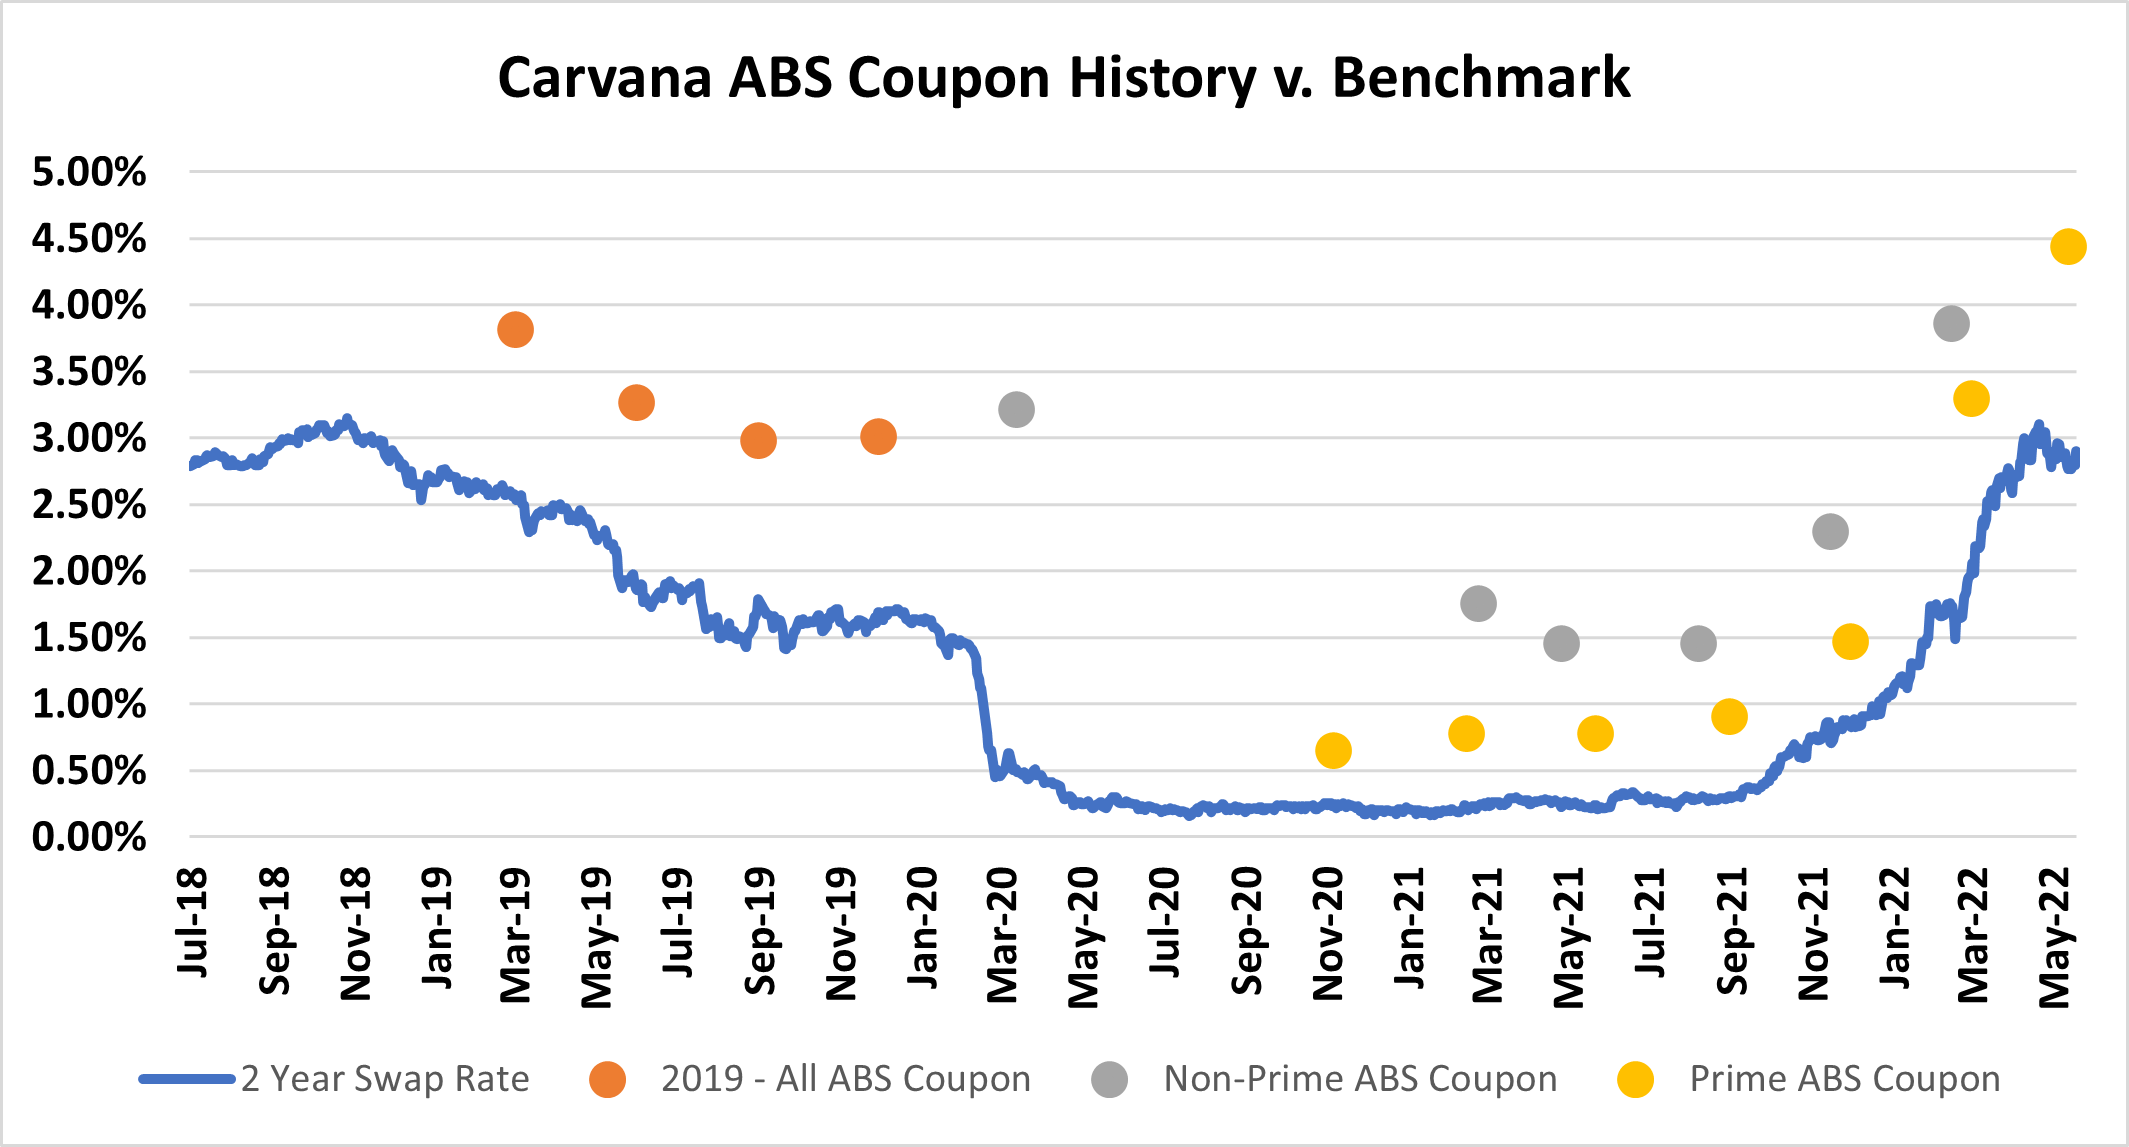
In 2019, Carvana entered the ABS securitization market and did one transaction each quarter. The pool consisted of the full range of loans Carvana originates, with ones meeting the forward flow agreement with Ally randomly selected to go into either forward flow or the ABS. The benchmark that fixed income investors use to price against is typically a two- or three-year interest rate swap, as that matches the weighted average life, although for any given tranche of the ABS it can be higher or lower. By 2020, Carvana started to further differentiate their securitizations by segregating prime and non-prime loans (using their internal deal score rating). This happened right as covid hit and the ABS markets stalled for a while so the company only did one prime and one non-prime ABS in 2020. Since 2021, however, Carvana has done a prime and non-prime ABS on a quarterly basis.
Kroll is a great free resource for looking at information from the securitization transactions. I have pulled a lot of the key information for each ABS – customer APR, coupon rates, and loss estimates – to model what the gain on sale theoretically looks like. The table is below and should open a larger version in a new tab if clicked on.
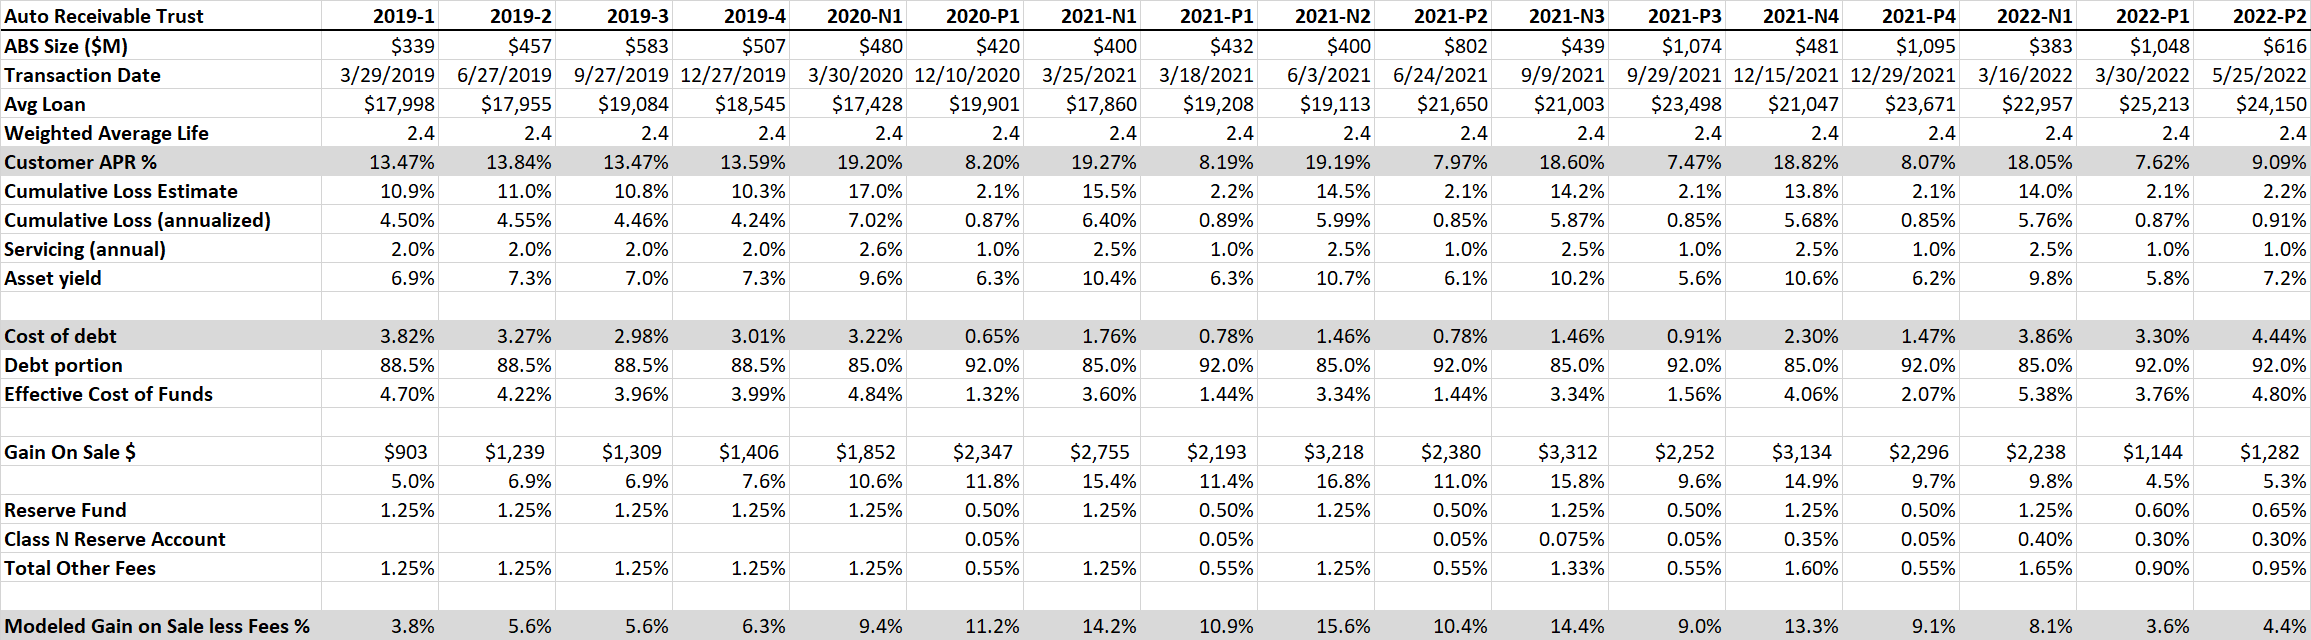
The trends in here are quite interesting and provide useful insight into what has happened. Gain on sale can be modeled as the present value of the asset yield (discounted by the cost of funds) less other fees. The calculation is very sensitive to small changes in the assumptions, so it is only useful as a theoretical exercise. Initially, with undifferentiated securitizations, the servicing fees were 2.0%. After splitting into prime and non-prime in 2020, the servicing fees shifted to 1.0% for prime and 2.5% for non-prime. The reserve fund fees for extra collateralization have dropped from 1.25% pre-split to 0.5% for prime and 1.25% for non-prime, until some recent bumps the past couple of transactions. Annualized loss estimates have remained just below 1% for prime but have dropped from above 7% to below 6% for non-prime as loan performance has proven solid. The key spreads to pay attention to are between the average customer APR and the cost of debt (coupon rate) as well as between the cost of debt and the benchmark interest rates (prior chart). Since Carvana tends to do securitizations on a quarterly basis, loans are priced 1-3 months prior to being sold versus just a couple of weeks in the forward flow agreements.
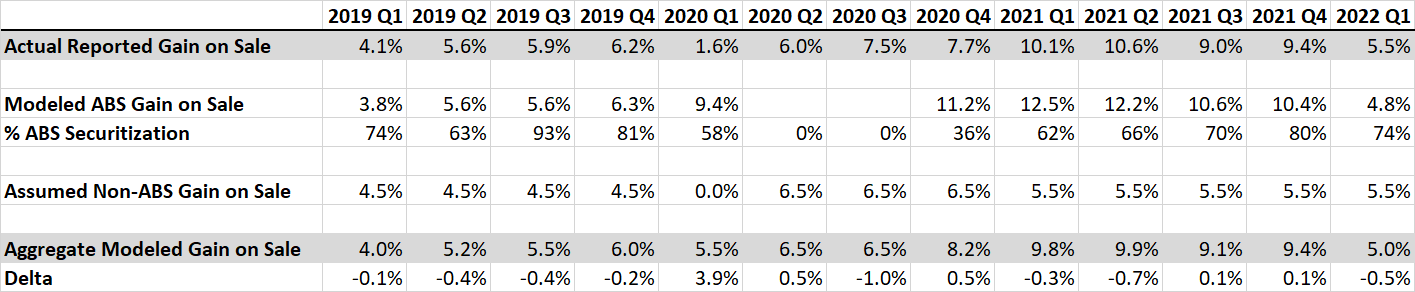
Weighting the modeled estimates for ABS gain on sale, I can compare to the actual reported numbers. See the table below. I put in assumptions for the forward flow gain on sale – this averaged 4.1% from 2017-2018 when there were no securitizations, and obviously there were some disruptions and renegotiations during the early covid days with Ally. I also suspect as Carvana loans have proven themselves out that Carvana is now getting a slightly higher gain on sale through the forward flow than previously. No quarter except 2020 Q1 is off by more than one percentage point. Perhaps Carvana was taking a loss on forward flow early in covid to ensure business continued unabated.
So, the real question going forward is what level of gain on sale can Carvana achieve? It seems very reasonable to think that 75-80% financing penetration can continue and that ~80% of finance receivables could be sold through the securitization market. In a more stable interest rate environment (early 2021), Carvana achieved 10%+ gain on sale while only using ABS markets for 60-70% of loans.
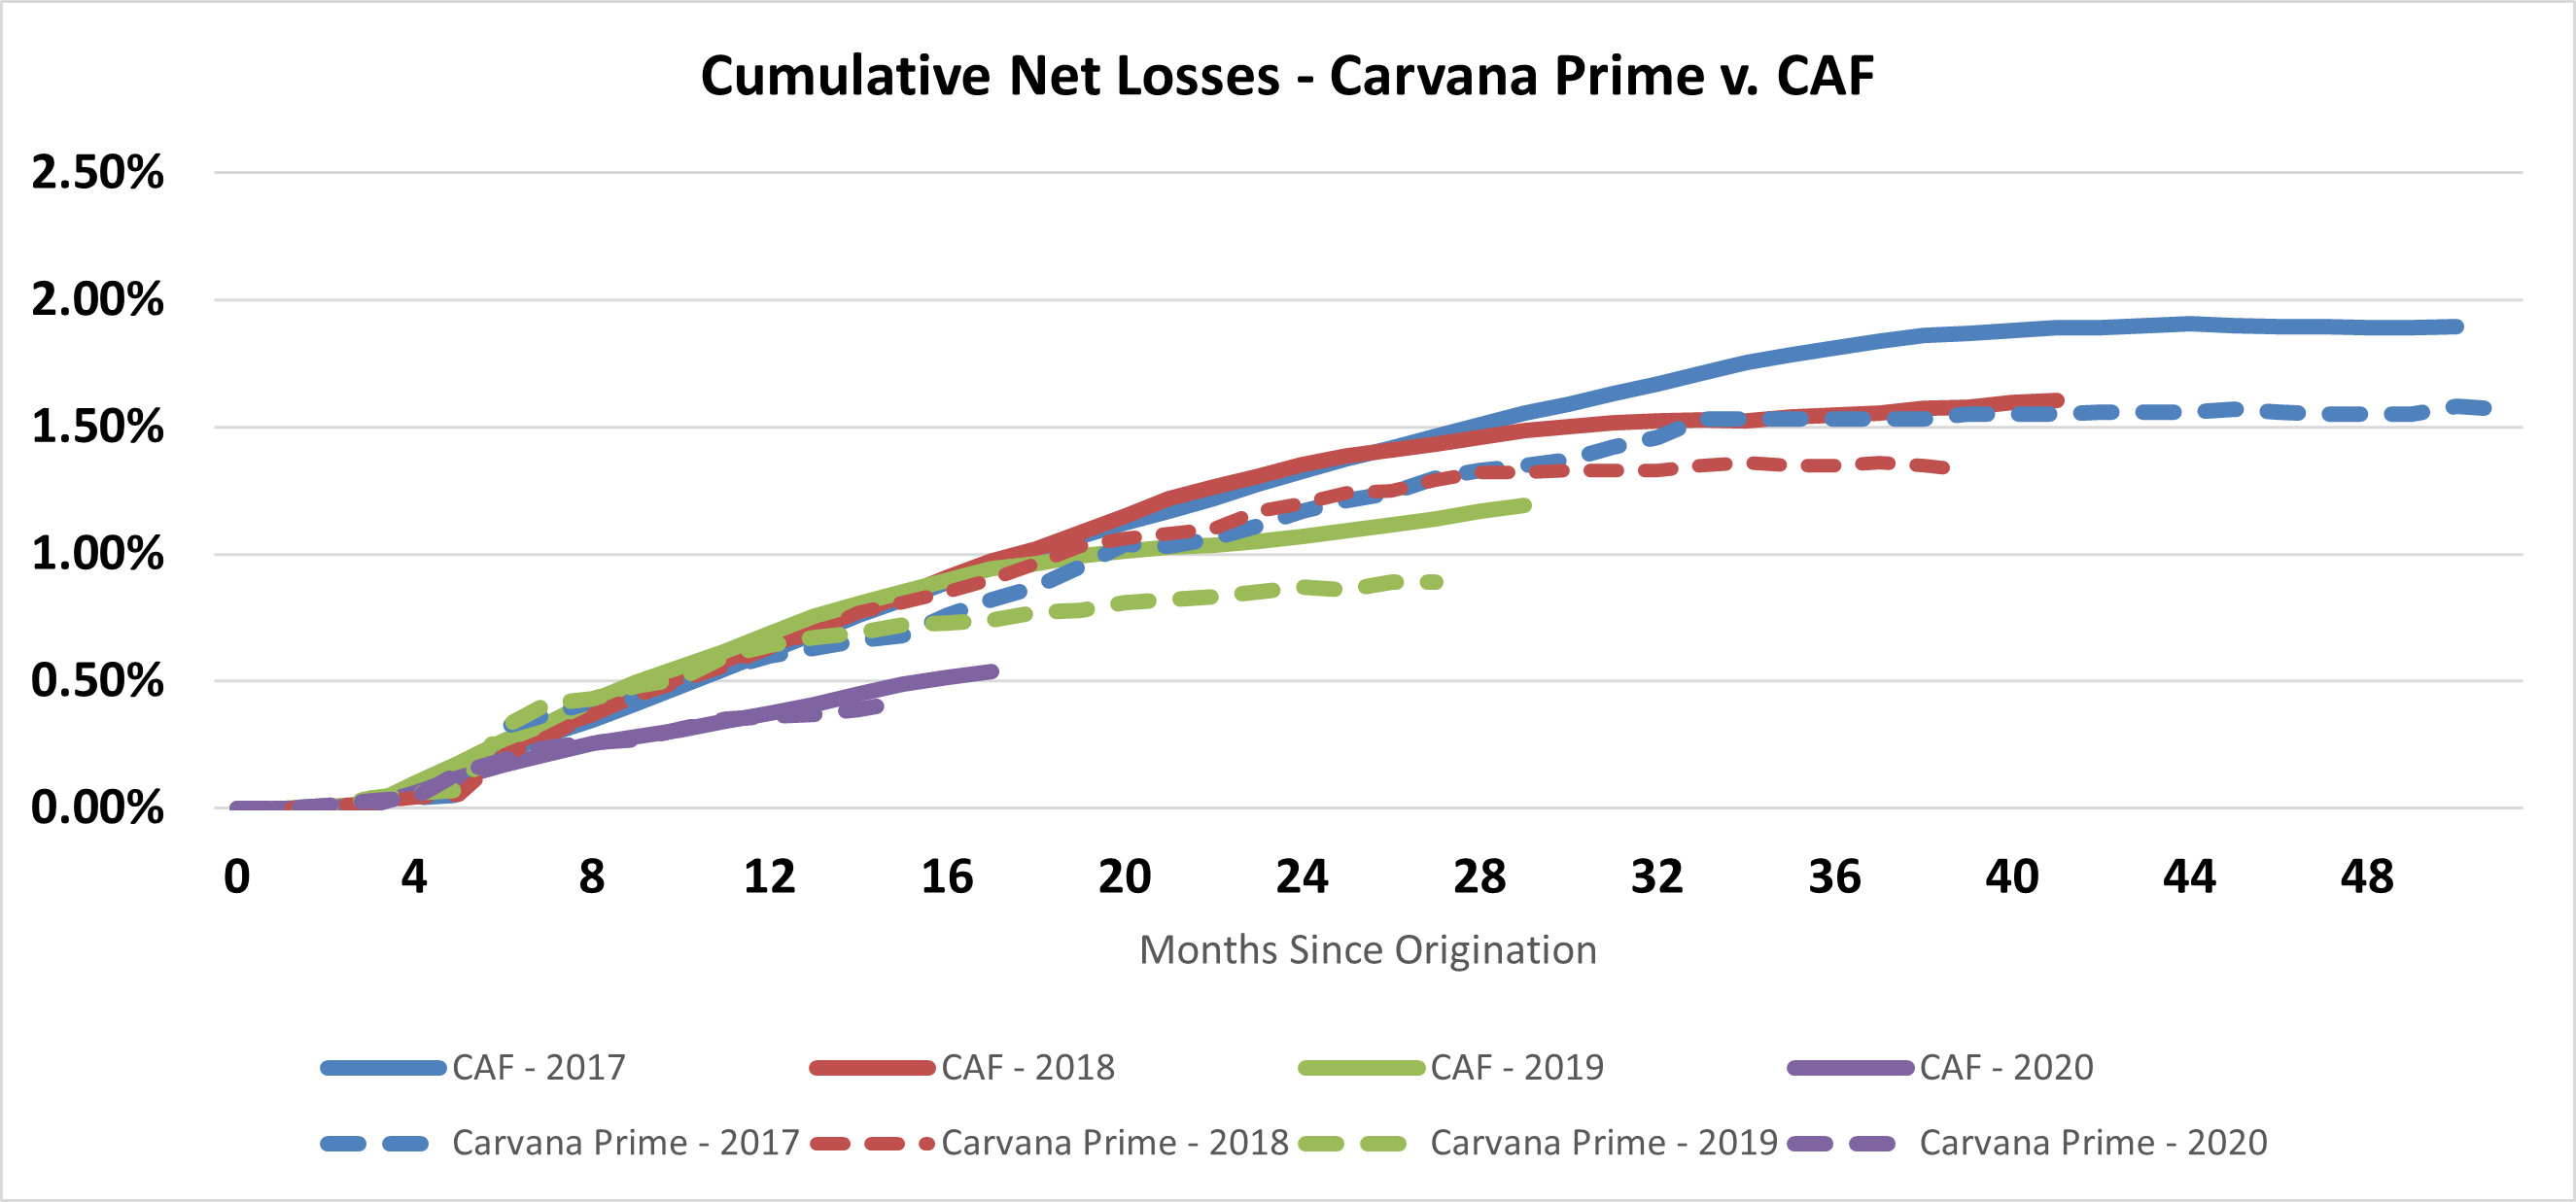
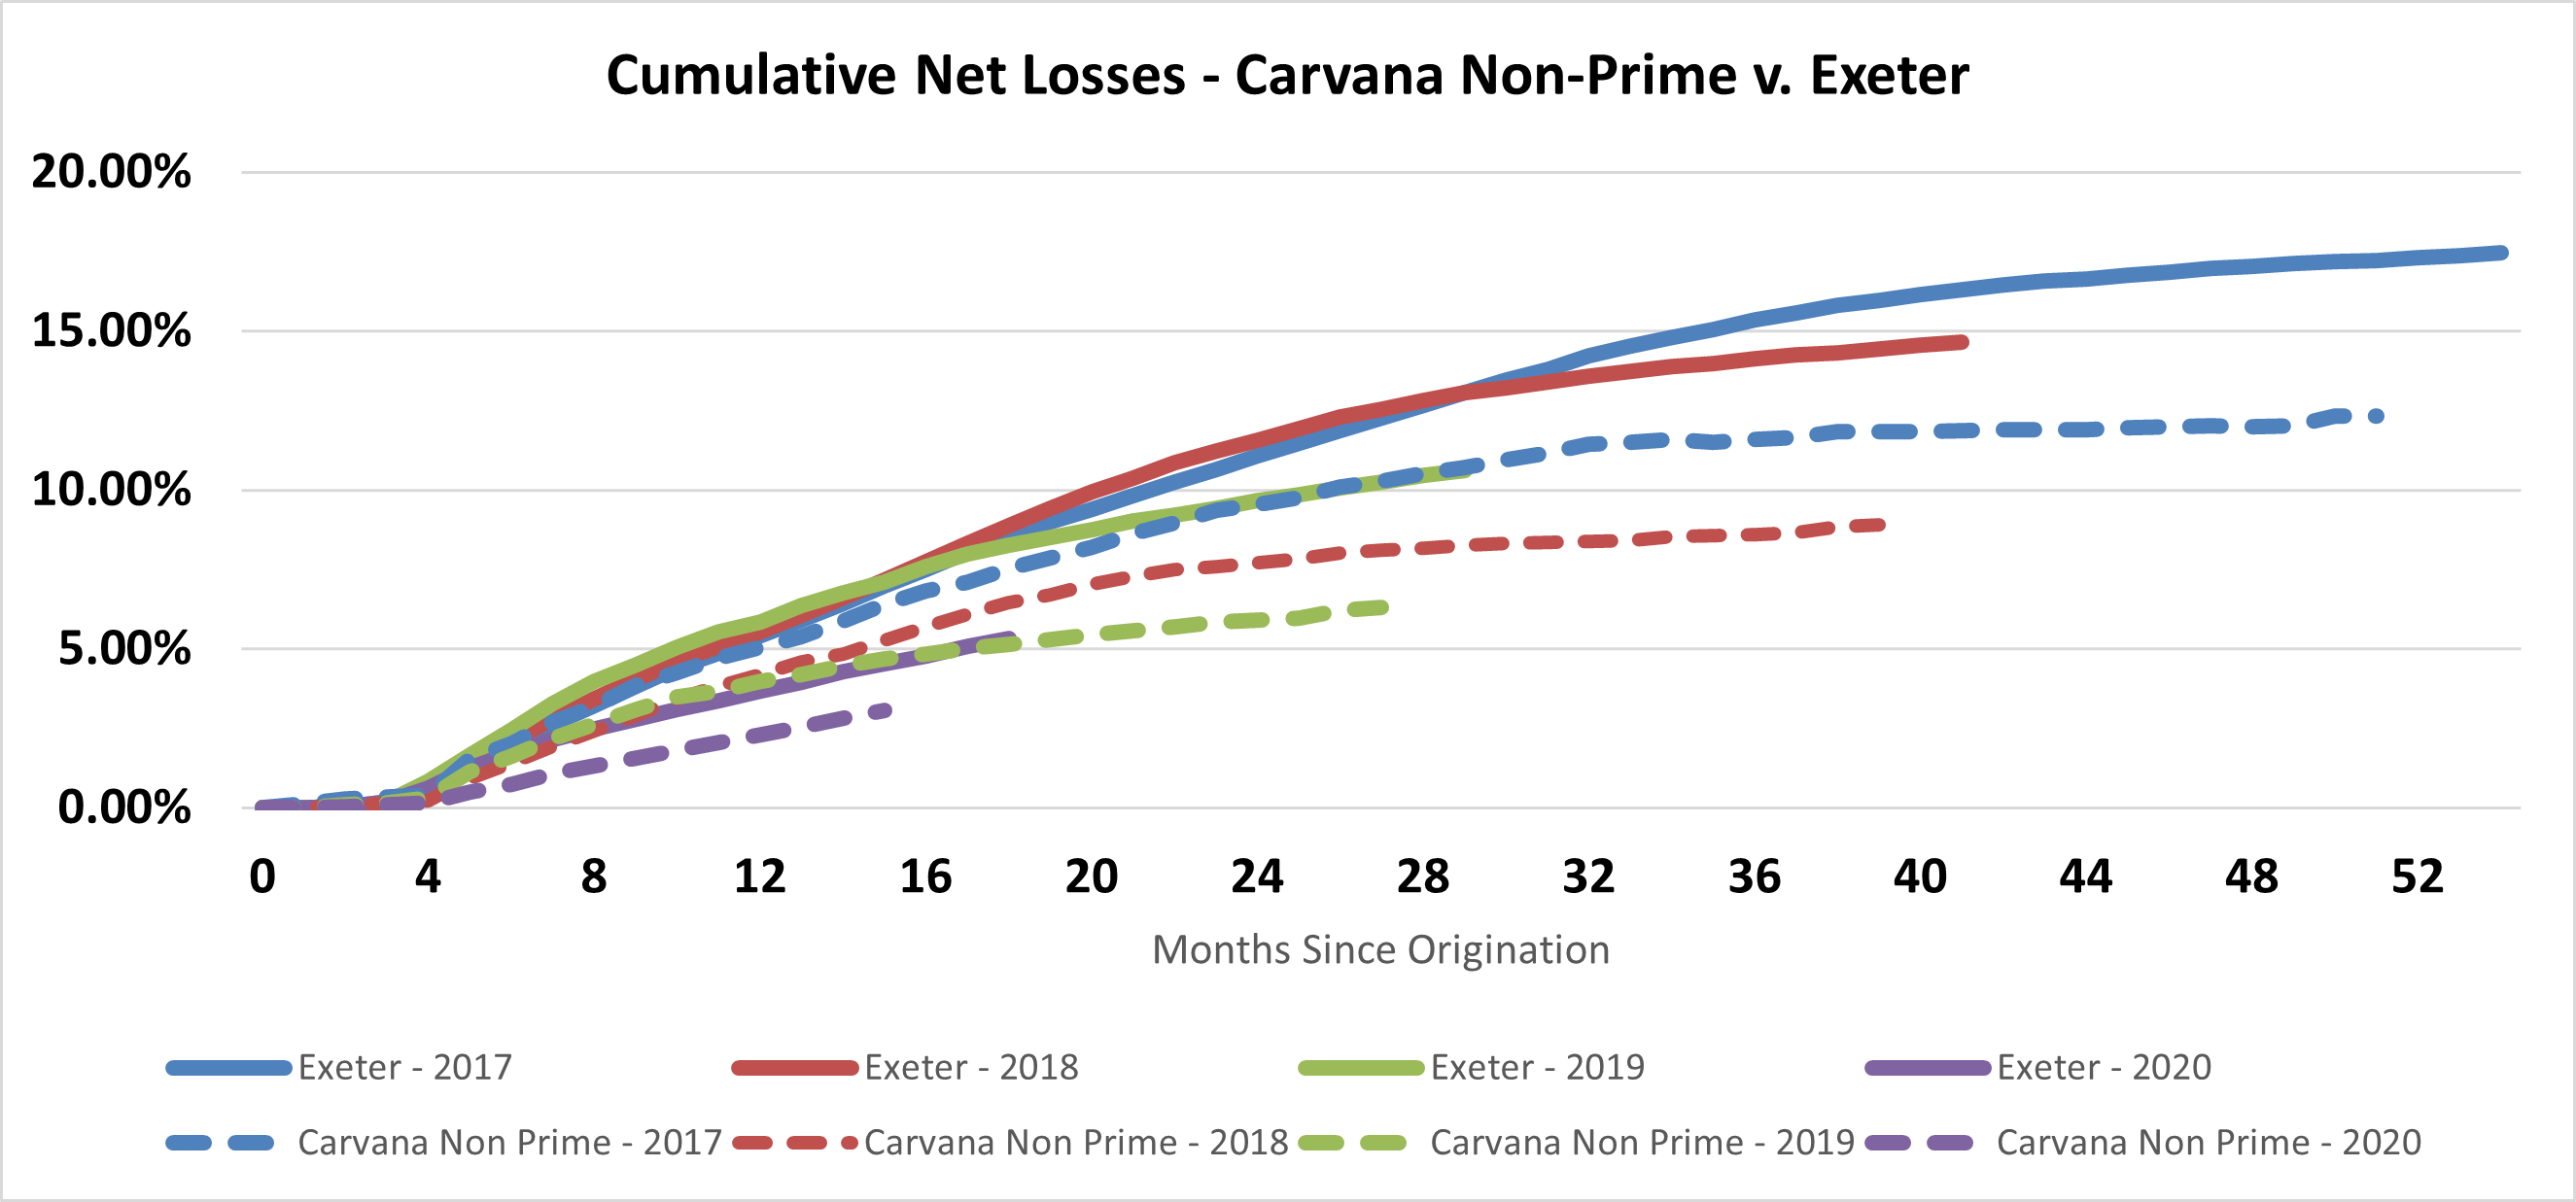
The biggest opportunity for pricing improvement likely lies with the fact that Carvana loans have continually outperformed expectations and their competitors. If investor appetite for these is strong in the future, there could be upside still. Below I plot Carvana prime net losses versus Carmax Auto Finance (CAF), and Carvana non-prime net losses versus Exeter for 2017 – 2020 vintages. There is not enough relevant data yet for 2021. Carvana tends to be 25-30 basis points better than CAF and 400-600 basis points better than Exeter further out the curves.
Carvana believes it has optimized the vertically integrated dealer-lender model to best capture the economics for used car sales. There is obviously a fair amount of interplay between pricing strategies and where GPU falls into either metal GPU or finance GPU. CFO Mark Jenkins even wrote his economics dissertation on subprime auto credit performance. Lower retail prices and better performing loans is an enviable position to have. The murky macroeconomic backdrop and recent growing pains will be interesting to follow for Carvana.
Useful Reading & Resources:
-Company investor overview deck, finance platform info, and first securitization breakdown
-10th Man blog deep dive
-Cliff Sosin letter on Carvana and unit economics
-InPractise interviews and content on Carvana
Disclosure: No position in Carvana. Not investment advice.
Really good work!