

Anaplan goes private

On Sunday night, software PE behemoth Thoma Bravo made a deal to buy Anaplan for $10.7B or $66/share. Having never looked at the company that closely I thought it might be an interesting exercise to briefly examine their history/metrics and digest the takeover price amongst the landscape of enterprise SAAS multiples.
Anaplan is a cloud-native enterprise planning and resource optimization software tool. Initially it gained traction in financial planning but has expanded well beyond to include sales, human resources, supply chain, marketing, and operations teams for large companies. As of January 2022, they had more than 1900 global customers, with nearly 30% of those spending more than $250K annually. If you want to read a bit more on their strategy and history, check out this note from Shomik Ghosh. Below are some of their key metrics over the last four years:
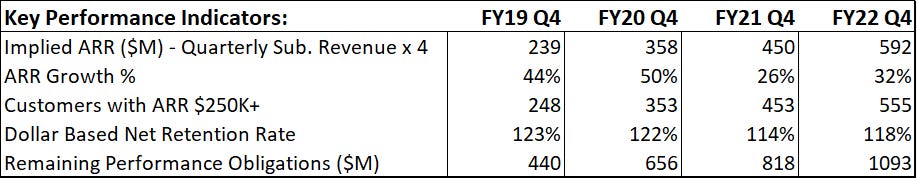
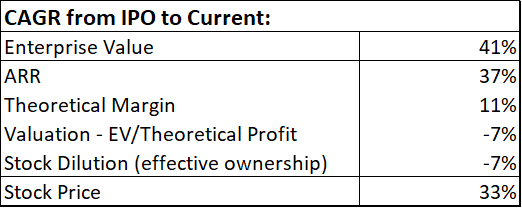
The company did an IPO in October 2018, opening at $24.25/share and closing the first day at $24.30. I will use that price as a basis for analysis instead of the $17 actual IPO price. That equates to a stock up 167% over nearly 3.5 years, good for a 33% CAGR over that time. (Stock is currently around $65, slightly below the deal price) Interestingly, most of that return happened in the first year as the stock traded between $45 and $63 during the six months preceding the covid pandemic. ARR growth has slowed to near 30% recently but has compounded at 37% since IPO. This clearly is the main driver of the stock returns. Aided by a small valuation expansion (14.5 to 16.1 on an EV/ARR basis) and stock dilution yields the stock rate of return.
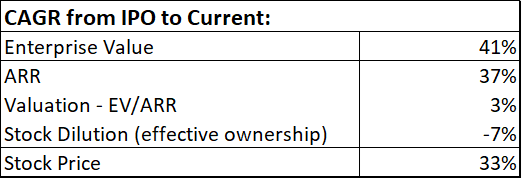
Note that these numbers do not match up perfectly due to geometric math and rounding.
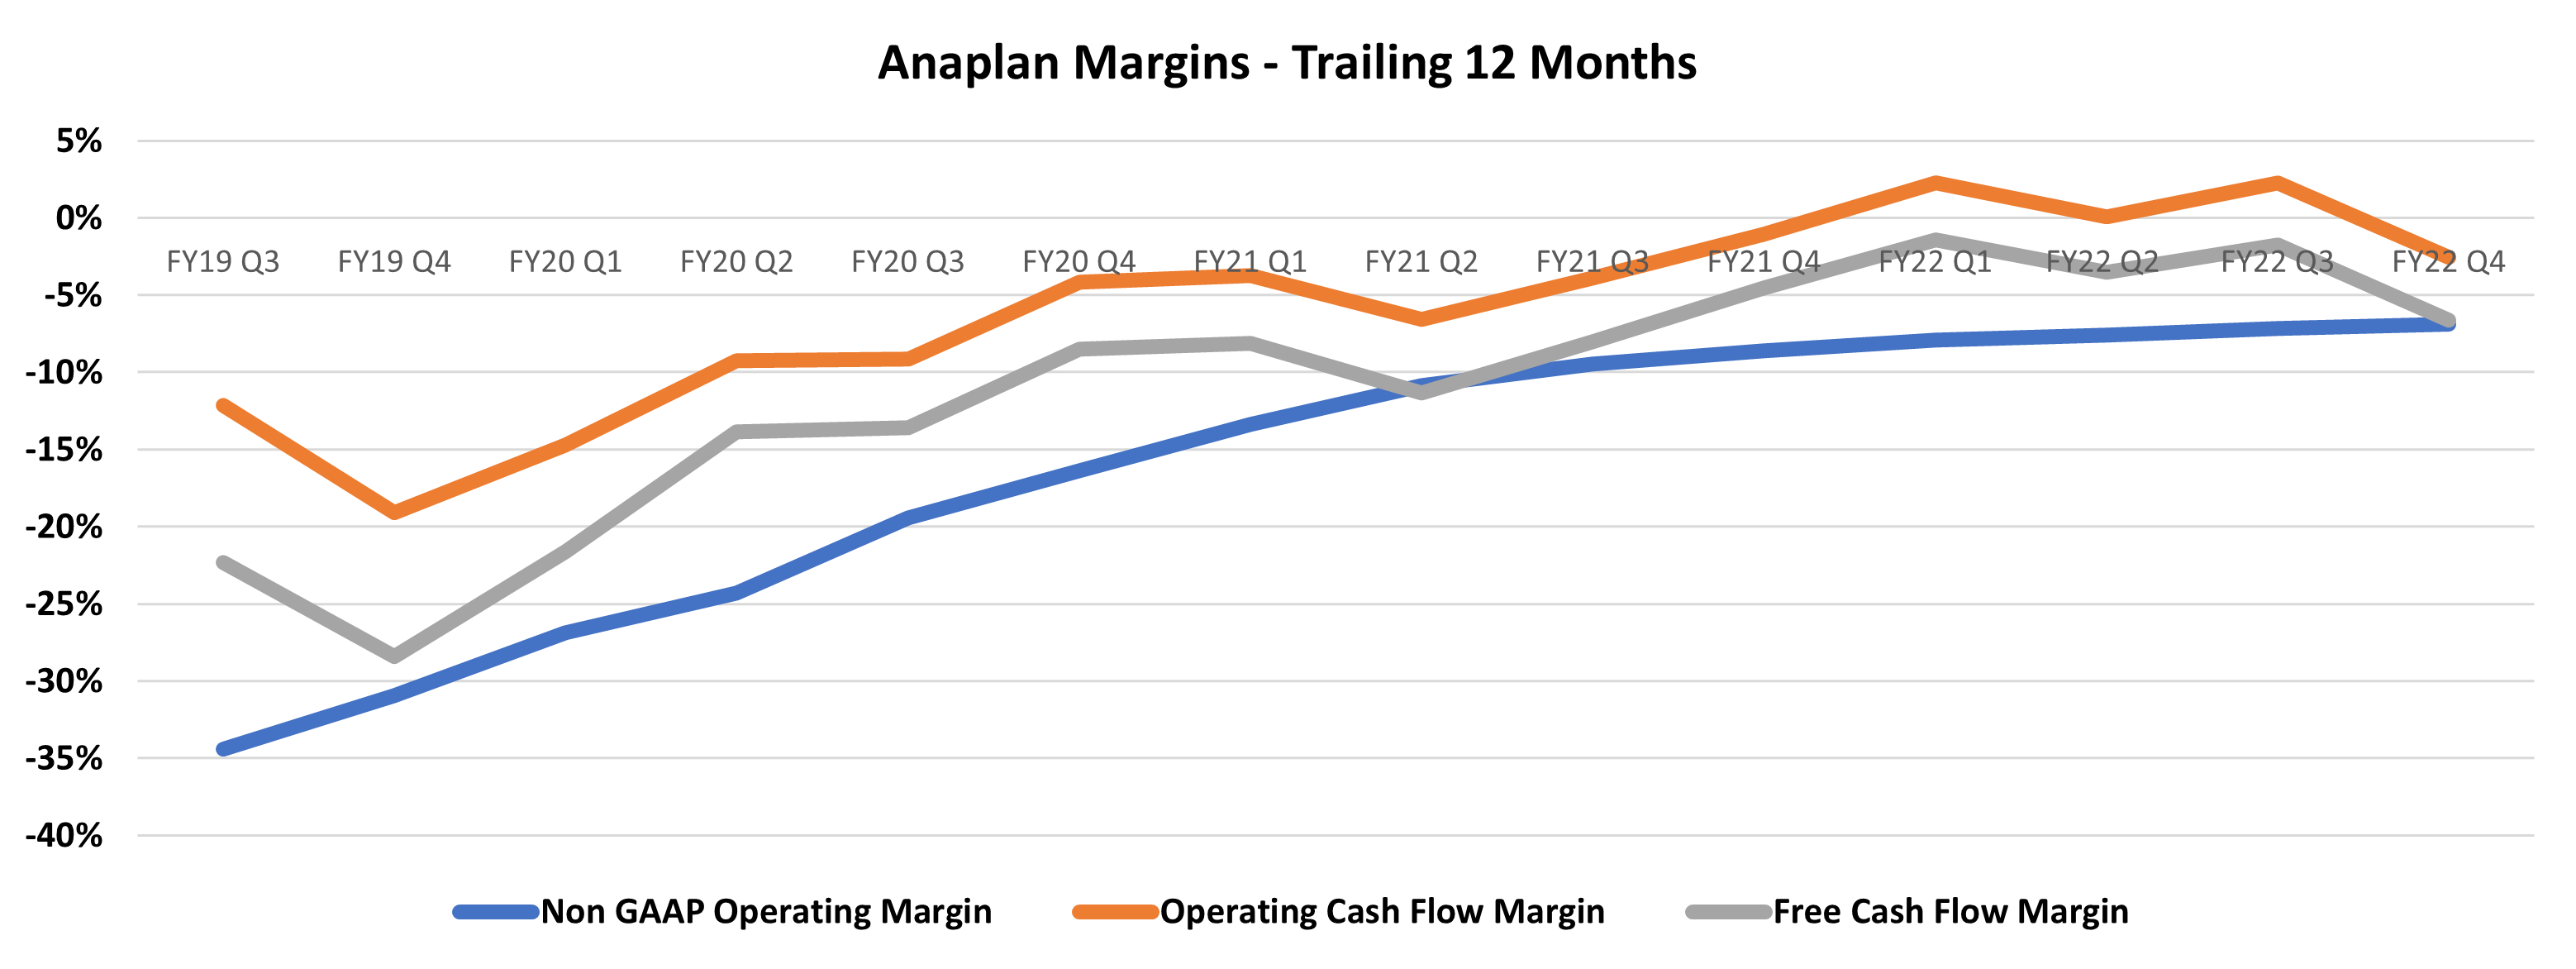
Although SAAS company valuations typically get compared on a revenue basis, they are not all the same. Eventually a company must show a path to sustained free cash flow generation. Anaplan has yet to show positive free cash flow over any trailing 12-month period.
I find it useful to look at the unit economics to better understand the potential future margin. To further breakdown Anaplan performance, I can then take the valuation component and break it into two subcomponents – the margin potential and valuation based on that margin potential.
Revisiting the Crowdstrike analysis from last year, I like to use three primary metrics for determining the margin potential: gross churn, cost to book (sales efficiency), and cost to serve (operating efficiency).
Cost to book is calculated using reported financials and I use the trailing sales and marketing spend divided by the net new implied ARR. I do not have precise non-GAAP numbers, but I subtract out stock-based compensation as a simple proxy.
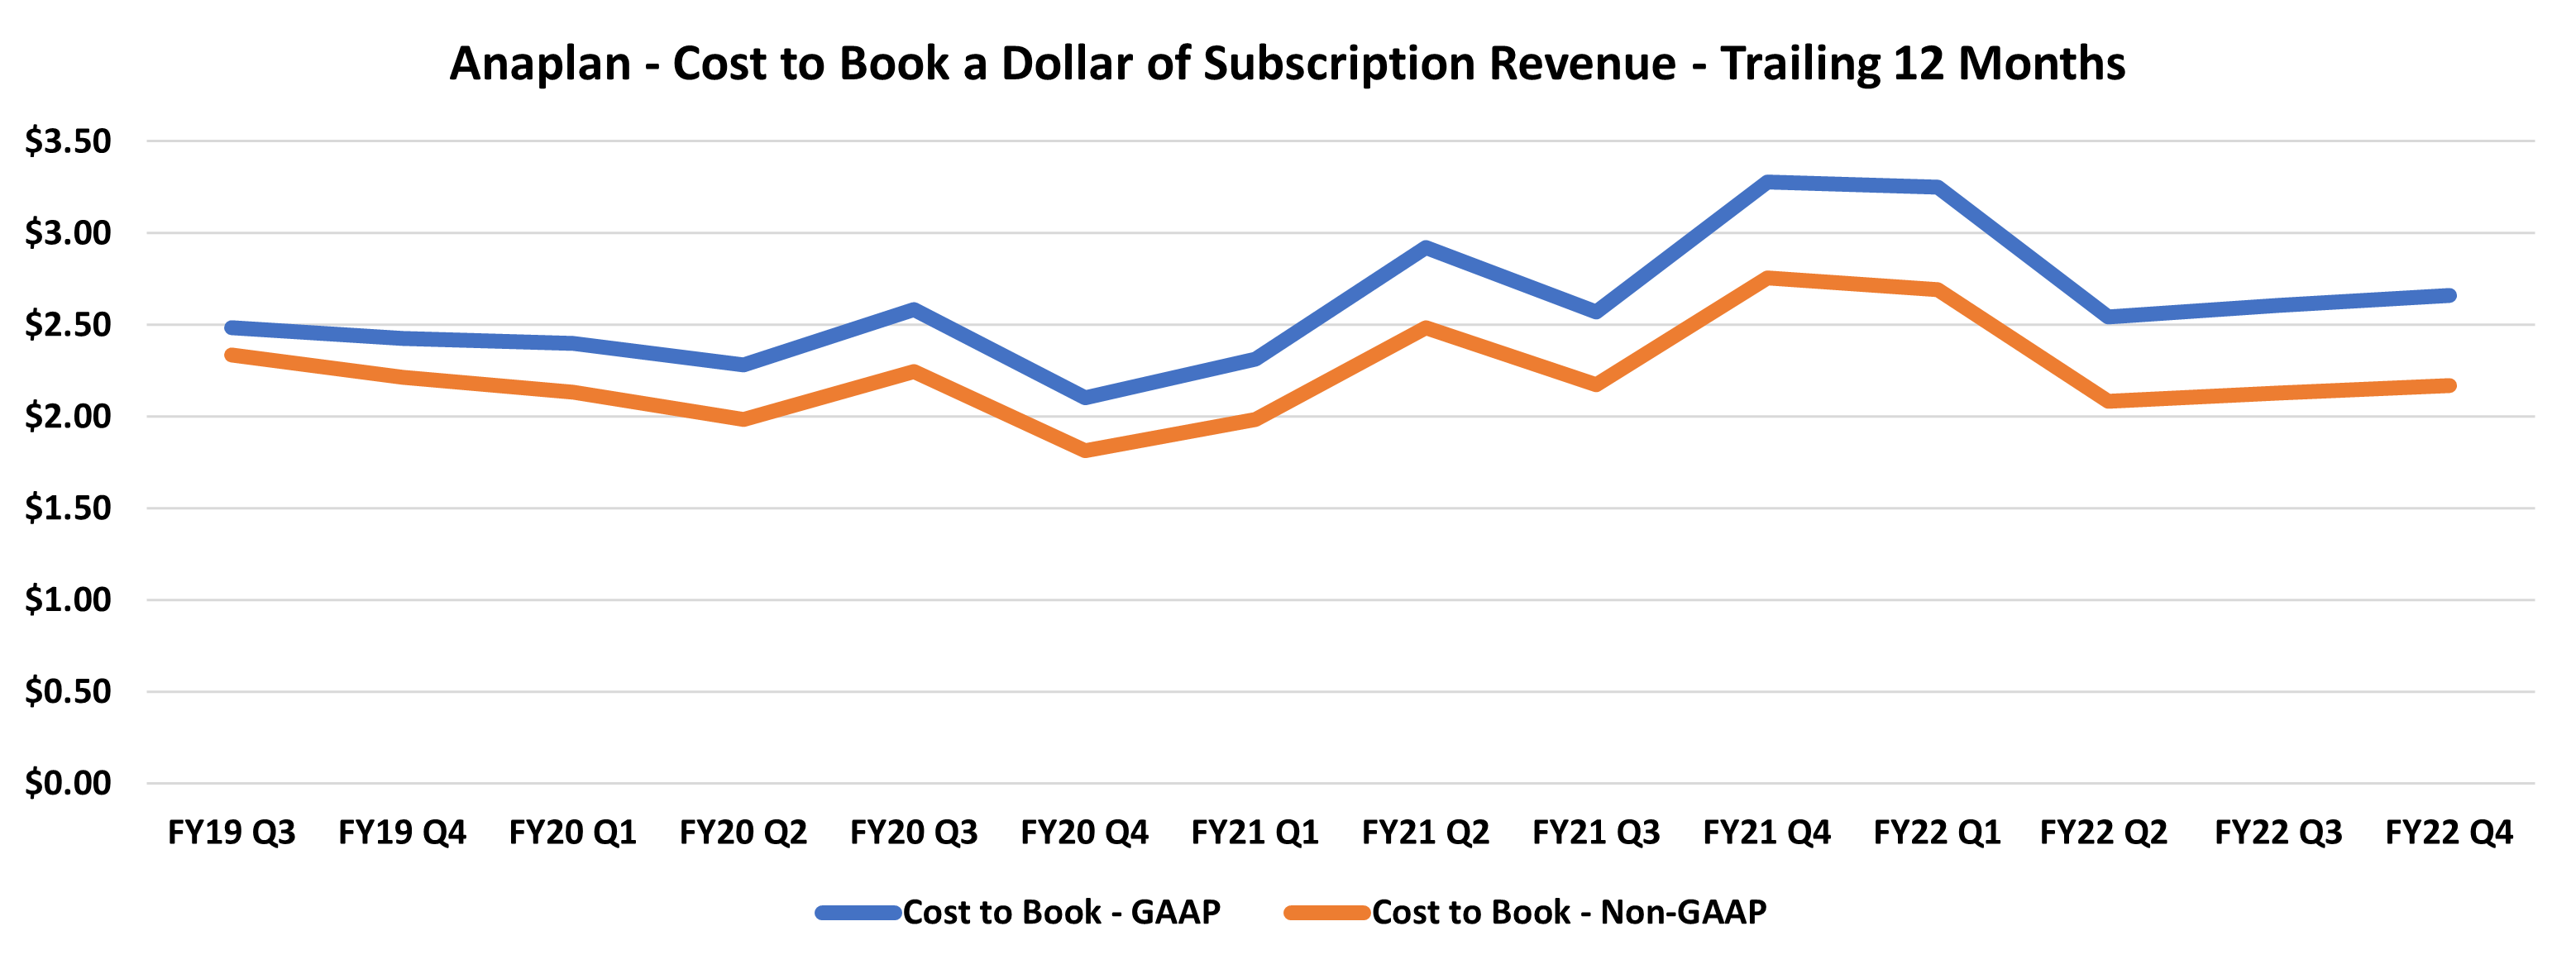
Anaplan, although steady in the $2-$3 range, is unimpressive on this metric. Even though enterprise sales lands are longer and more costly than SMB, most dominant SAAS companies (think Salesforce, Workday) are $1-$2, while elite performers in recent times (Datadog, Crowdstrike) have even been sub $1.
Cost to serve is subscription gross profit less R&D and G&A expenses, divided by subscription revenue. I also track this on a trailing basis and similarly subtract stock-based compensation as a proxy for non-GAAP.
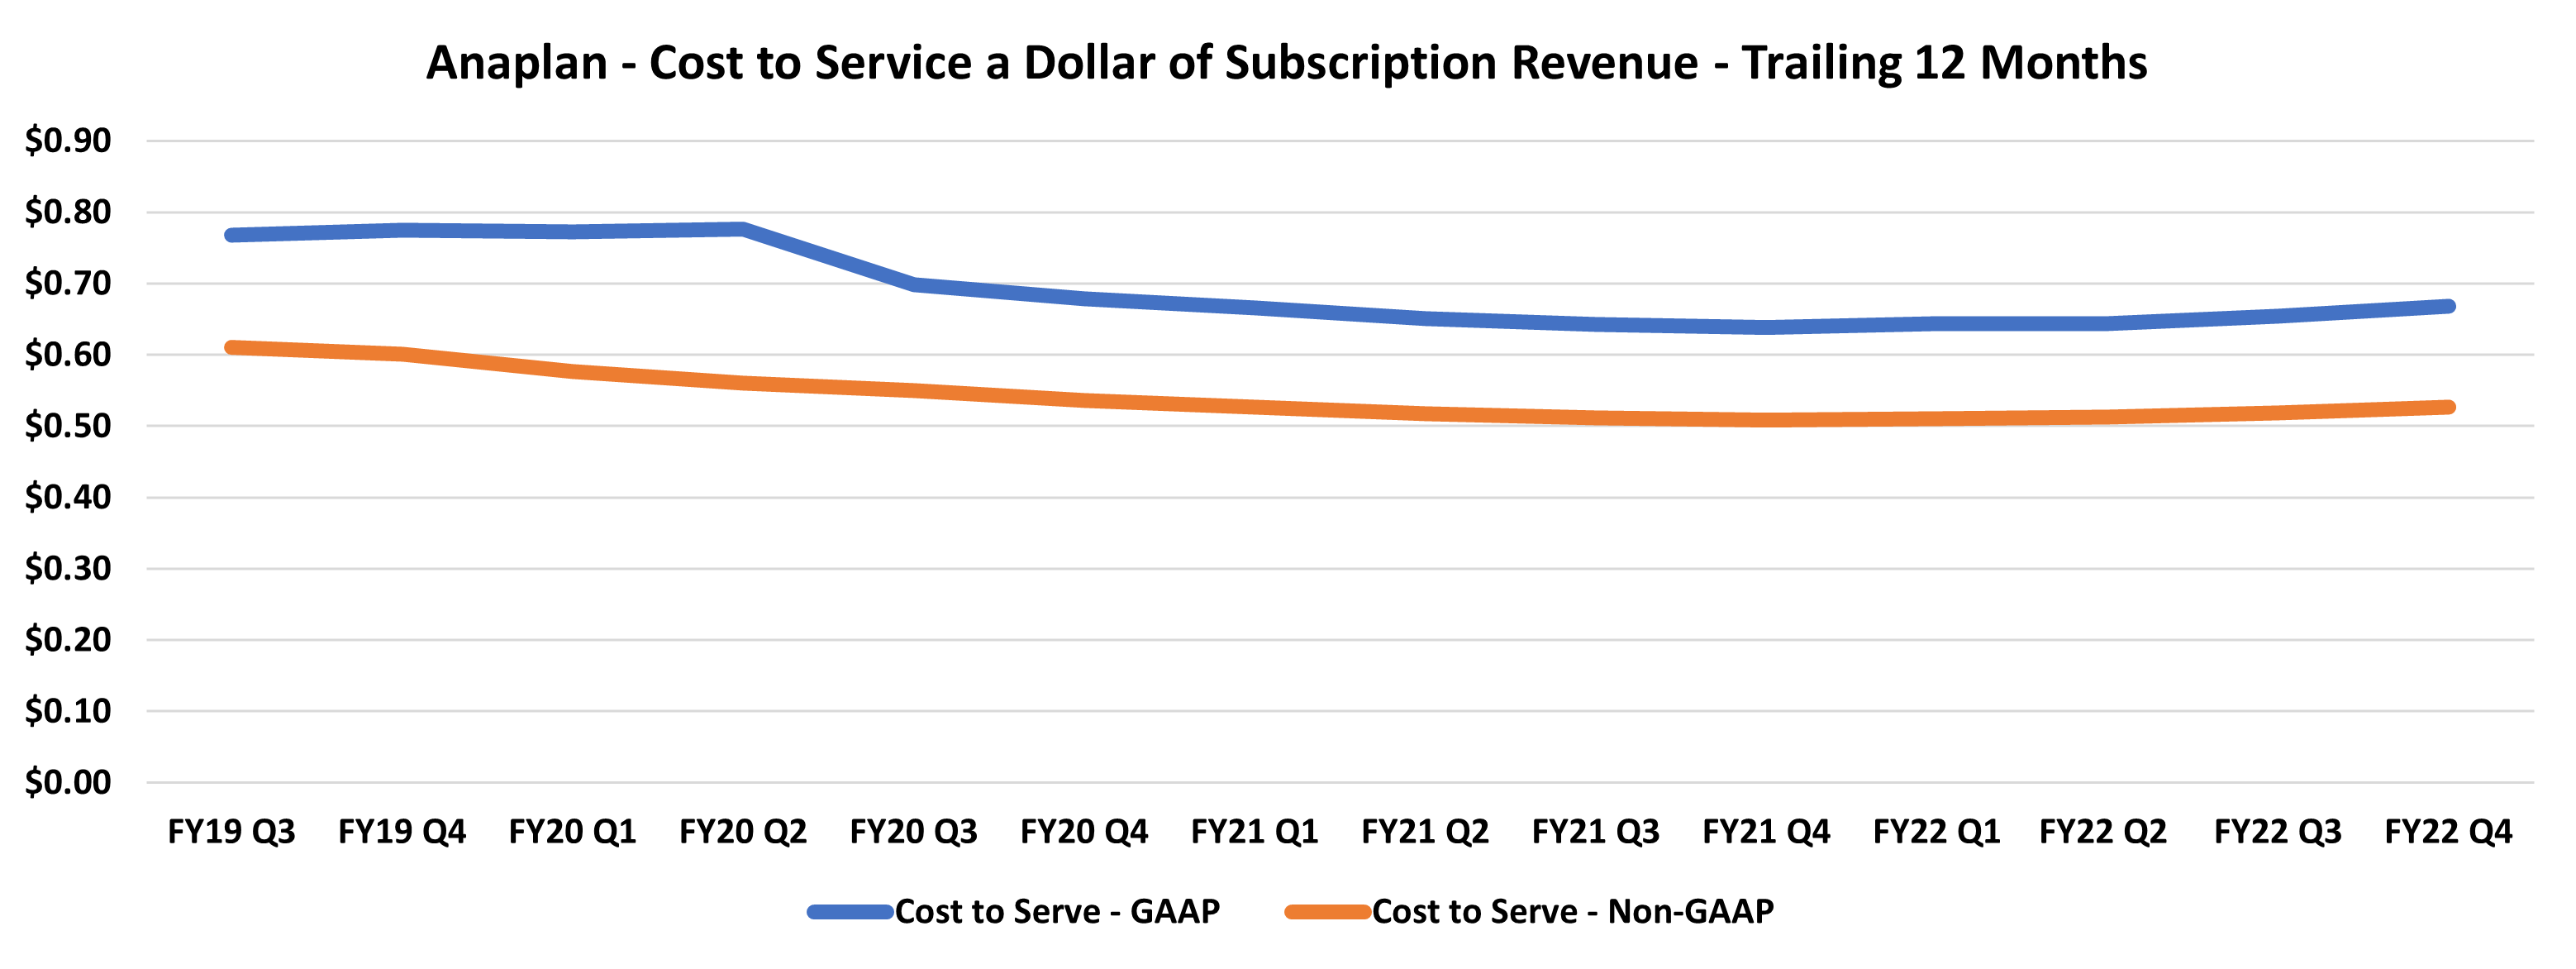
The cost to serve has stagnated in the $0.50-$0.55 range the past couple years on a non-GAAP basis. Comparing the cost to book with the cost to serve allows for a payback time to be calculated and that has dropped from 6 years at IPO to 4.6 years currently. Again, I would consider this to be unimpressive relative to other major SAAS companies.
The final piece of the potential margin puzzle is gross churn. Although Anaplan does not report this metric, this recent table from Goldman Sachs lists them at 7%, which I feel comfortable using as an estimate. This is lower than most SMB SAAS and even a company like Salesforce, but higher than mission critical SAAS like ServiceNow or Crowdstrike. Assuming a consistent 7% gross churn for Anaplan, I calculate their theoretical margin potential rising from 23% at IPO to 32% currently. I am using non-GAAP numbers here to best proxy what the FCF margin could look like if the growth engines were shut down. This also imputes that valuation, on an EV to theoretical profits basis, has dropped from 64 at IPO to 50 currently. Yes, that is incredibly steep, especially for hypothetical profits. But that somewhat makes sense for growth that was mid 40% at IPO and still above 30% currently.
A 33% IRR for the stock is certainly nothing to scoff at and shareholders should be pleased. But my main takeaway is that durable revenue growth with loss gross churn can be very valuable to a strategic acquirer, even with unimpressive unit economics. Thoma Bravo will have to pull some levers to turn this into a cash generator.
Disclosure: not investment advice.